Fig. 4
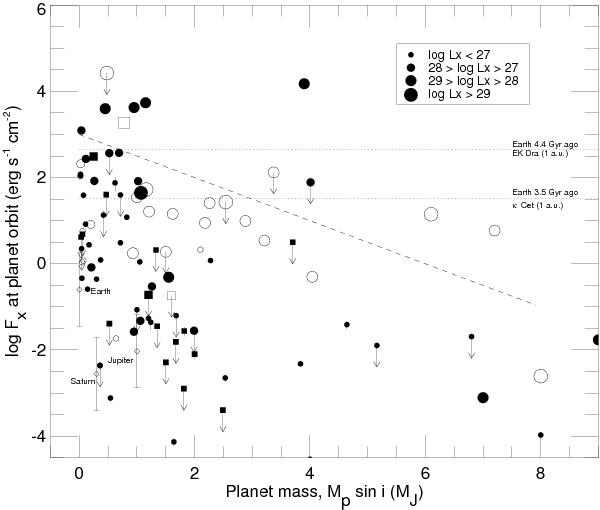
Distribution of planetary masses (Mpsini) with X-ray flux at the planet orbit. Filled symbols (squares for subgiants, circles for dwarfs) are XMM-Newton and Chandra data. Arrows indicate upper limits. Open symbols are ROSAT data without error bars. Diamonds represent Jupiter, Saturn, and the Earth. The dashed line marks the “erosion line” that might separate the phases of strong and weak evaporation (Paper I). Dotted lines indicate the X-ray flux of the younger Sun at 1 au.
Current usage metrics show cumulative count of Article Views (full-text article views including HTML views, PDF and ePub downloads, according to the available data) and Abstracts Views on Vision4Press platform.
Data correspond to usage on the plateform after 2015. The current usage metrics is available 48-96 hours after online publication and is updated daily on week days.
Initial download of the metrics may take a while.