Free Access
Fig. C.2
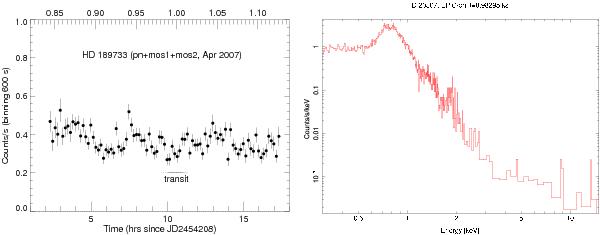
The data server X-Exoplanets. Light curve (left) and reduced spectrum (right). In the light curve of HD 189733 we mark the orbital phase (Winn et al. 2007) of HD 189733 b in the upper axis, as well as the interval when the transit takes place (partial in dotted line, total in solid line).
This figure is made of several images, please see below:
Current usage metrics show cumulative count of Article Views (full-text article views including HTML views, PDF and ePub downloads, according to the available data) and Abstracts Views on Vision4Press platform.
Data correspond to usage on the plateform after 2015. The current usage metrics is available 48-96 hours after online publication and is updated daily on week days.
Initial download of the metrics may take a while.