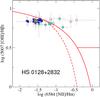
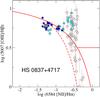
Fig. 5
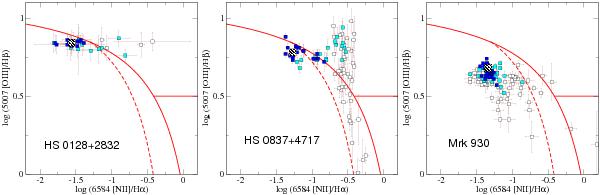
Relation between log([Nii]/Hα) and log([Oiii]/Hβ). one of the so-called BPT diagrams for the individual spaxels of the three studied galaxies. Dark blue squares represent the spaxels in Region 1, the light blue, Region 2, and the white all the rest. Large stripped squares represent the result of the integrated spectrum of Region 1. The red dashed line represents the empirical curve defined by Kauffman et al. (2003) to separate star-forming galaxies from active galactic nuclei. The solid line represents the theoretical separation defined by Kewley et al. (2001).
Current usage metrics show cumulative count of Article Views (full-text article views including HTML views, PDF and ePub downloads, according to the available data) and Abstracts Views on Vision4Press platform.
Data correspond to usage on the plateform after 2015. The current usage metrics is available 48-96 hours after online publication and is updated daily on week days.
Initial download of the metrics may take a while.