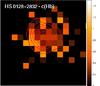
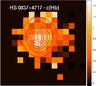
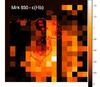
Fig. 4
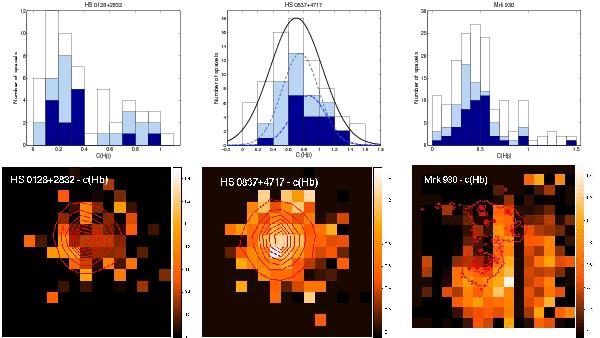
Reddening constant maps of HS 0128+2832, HS 0837+4717, and Mrk 930 from left to right. The solid line contours are those described in Fig. 3. The histogram plots above represent the distribution of the extinction in different regions: dark blue bars represent the spaxels in Region 1 (spaxels with a F(Hα) larger than 25% of the maximum), light blue bars, in Region 2 (spaxels with F(Hα) larger than 12.5% of the maximum), and white bars, Region 3 (all the spaxels in the observed field with S/N).
Current usage metrics show cumulative count of Article Views (full-text article views including HTML views, PDF and ePub downloads, according to the available data) and Abstracts Views on Vision4Press platform.
Data correspond to usage on the plateform after 2015. The current usage metrics is available 48-96 hours after online publication and is updated daily on week days.
Initial download of the metrics may take a while.