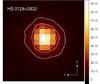
Fig. 3
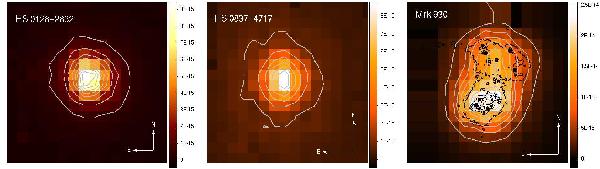
Extinction-corrected Hα maps of HS 0128+2832, HS 0837+4717, and Mrk 930 from left to right. The gray solid line contours show the isophotes in units of 12.5% of the maximum of Hα. In the Mrk 930 image, black solid lines represent the contours extracted from the ACS-HST UV image shown in Fig. 2, which represent the position of the brightest super star clusters. In all images, each spaxel has 1′′ of resolution, north points up and east to the left. Units are in erg/s/cm2 / Å.
Current usage metrics show cumulative count of Article Views (full-text article views including HTML views, PDF and ePub downloads, according to the available data) and Abstracts Views on Vision4Press platform.
Data correspond to usage on the plateform after 2015. The current usage metrics is available 48-96 hours after online publication and is updated daily on week days.
Initial download of the metrics may take a while.