Fig. 8
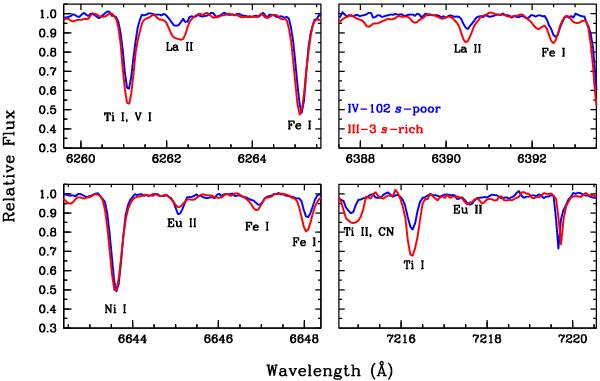
Comparison of the spectra of La lines (top panels) and Eu lines (bottom panels) in two stars with similar atmospheric parameters but substantially different derived La abundances. The displayed data are taken from the MCD spectra. The spectrum in red is that of the s-rich star III-3, and the one in blue is that of the s-poor star IV-102.
Current usage metrics show cumulative count of Article Views (full-text article views including HTML views, PDF and ePub downloads, according to the available data) and Abstracts Views on Vision4Press platform.
Data correspond to usage on the plateform after 2015. The current usage metrics is available 48-96 hours after online publication and is updated daily on week days.
Initial download of the metrics may take a while.