Fig. 7
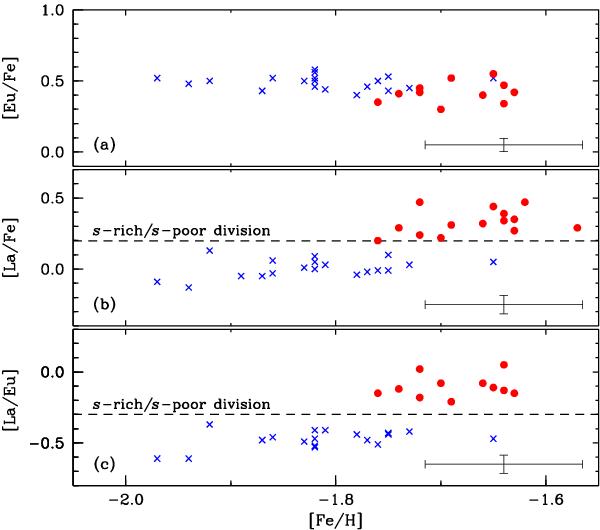
La and Eu abundances of M 22 as functions of [Fe/H]. In panels a) and b) we repeat the [Eu/Fe] and [La/Fe] panels of Fig. 6. In panel b) we have added a dashed line at [La/Fe] = + 0.2 to show the division in this abundance ratio between s-rich and s-poor stars; see text for discussion of this choice. In panel c) we plot the [La/Eu] values; the separation between the two groups of stars is more obvious here, and the dashed line represents our chosen split at [La/Eu] = −0.3. Symbols are as in Fig. 6.
Current usage metrics show cumulative count of Article Views (full-text article views including HTML views, PDF and ePub downloads, according to the available data) and Abstracts Views on Vision4Press platform.
Data correspond to usage on the plateform after 2015. The current usage metrics is available 48-96 hours after online publication and is updated daily on week days.
Initial download of the metrics may take a while.