Fig. 19
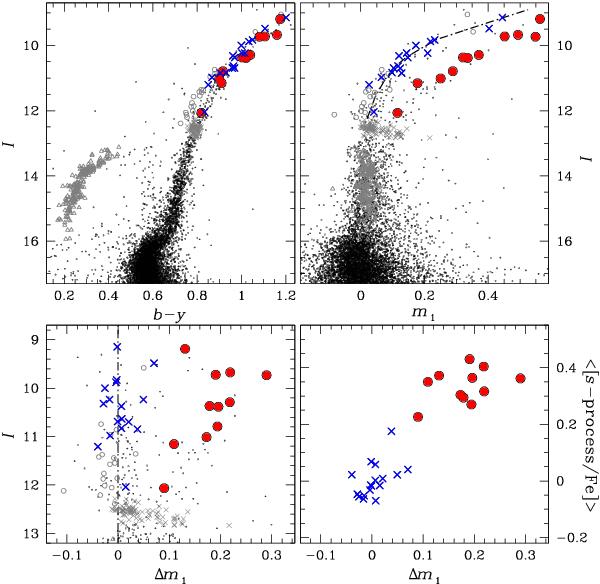
Top panels: I-b − y (left) and I-m1 (right) CMD for M 22, corrected for differential reddening. The grey symbols represent HB stars (triangles), probable AGB stars (circles) and RGB bump stars (crosses) selected in the I-(b − y) CMD. Spectroscopic data are superimposed with s-rich stars represented by red circles, and s-poor stars by blue crosses, according with the other figures. Bottom panels: colour difference Δm1 between each analyzed star and a reference fiducial line represented as a dotted line (left panel). On the right panel the ⟨ [s/Fe] ⟩ average abundances are shown as a function of Δm1. The sources for the photometric data are given in Sect. 2.
Current usage metrics show cumulative count of Article Views (full-text article views including HTML views, PDF and ePub downloads, according to the available data) and Abstracts Views on Vision4Press platform.
Data correspond to usage on the plateform after 2015. The current usage metrics is available 48-96 hours after online publication and is updated daily on week days.
Initial download of the metrics may take a while.