Fig. 18
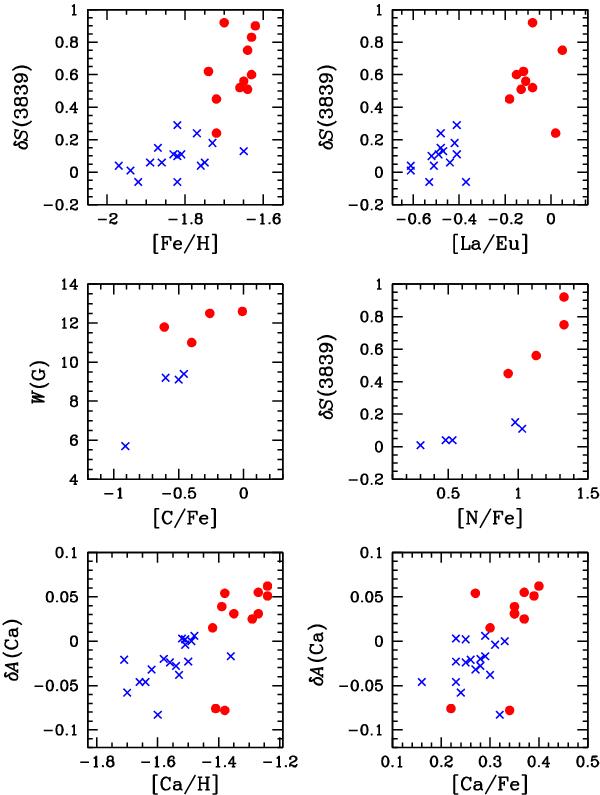
Comparison of the chemical abundances derived in this paper with the indices by Norris & Freeman (1983): CN band-strength indices δS(3839) plotted as a function of the [Fe/H] (left-upper panel) and [La/Eu] (right-upper panel), W(G) and δS(3839) as a function of [C/Fe] (left-middle panel) and [N/Fe] (right-middle panel), and δA(Ca) as a function of [Ca/H] (left-bottom panel) and [Ca/Fe] (right-bottom panel). Symbols are as in Fig. 6.
Current usage metrics show cumulative count of Article Views (full-text article views including HTML views, PDF and ePub downloads, according to the available data) and Abstracts Views on Vision4Press platform.
Data correspond to usage on the plateform after 2015. The current usage metrics is available 48-96 hours after online publication and is updated daily on week days.
Initial download of the metrics may take a while.