Fig. 17
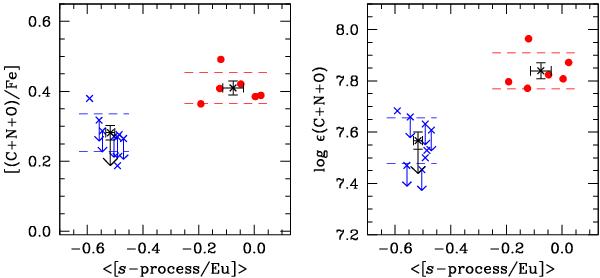
[(C+N+O)/Fe] (left panel) and log ϵ(C+N+O) (right panel) as a function of ⟨ [s-process/Eu] ⟩ . Symbols are as in Fig. 6. The dashed lines represent the error associated with single measures, the black error bars represent the mean CNO abundance contents for the two s-groups and the statistical error associated with the mean.
Current usage metrics show cumulative count of Article Views (full-text article views including HTML views, PDF and ePub downloads, according to the available data) and Abstracts Views on Vision4Press platform.
Data correspond to usage on the plateform after 2015. The current usage metrics is available 48-96 hours after online publication and is updated daily on week days.
Initial download of the metrics may take a while.