Fig. 14
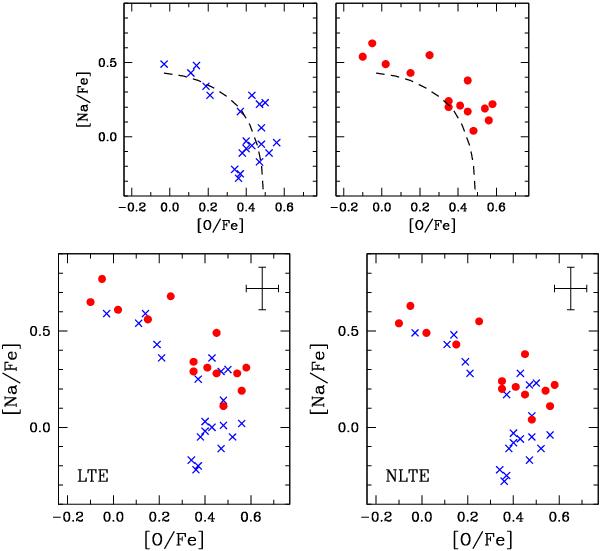
[Na/Fe] as a function of [O/Fe]. The bottom panels display all stars in the Na-O plane by using LTE (left) and NLTE Na abundances (right). The top left-hand panel contains only s-poor stars and the top right-hand panel contains only s-rich stars. The dashed lines in the top panels represent a free-hand representation of the mean Na-O trend of only the s-poor stars. Symbols are as in Fig. 6.
Current usage metrics show cumulative count of Article Views (full-text article views including HTML views, PDF and ePub downloads, according to the available data) and Abstracts Views on Vision4Press platform.
Data correspond to usage on the plateform after 2015. The current usage metrics is available 48-96 hours after online publication and is updated daily on week days.
Initial download of the metrics may take a while.