Free Access
Fig. 11
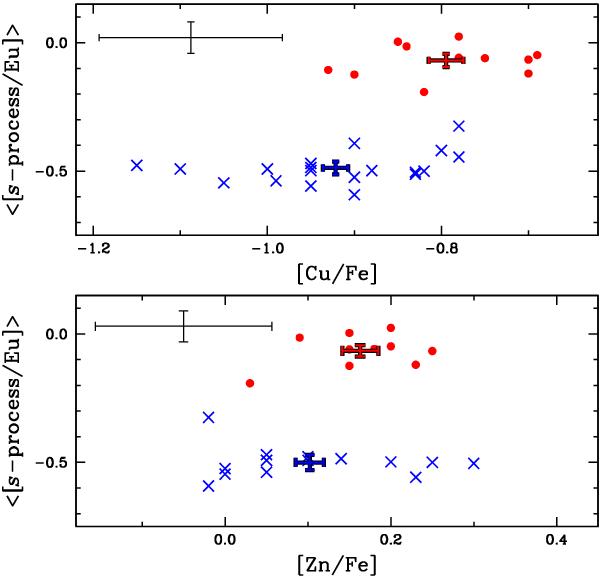
Average s-process abundance ratios with respect to Eu, plotted as functions of the ratios of the heavy Fe-peak elements Cu and Zn to Fe. Error bars in blue and red represent the mean values for the s-rich and s-poor stars. Symbols are as in Fig. 6.
Current usage metrics show cumulative count of Article Views (full-text article views including HTML views, PDF and ePub downloads, according to the available data) and Abstracts Views on Vision4Press platform.
Data correspond to usage on the plateform after 2015. The current usage metrics is available 48-96 hours after online publication and is updated daily on week days.
Initial download of the metrics may take a while.