Fig. 10
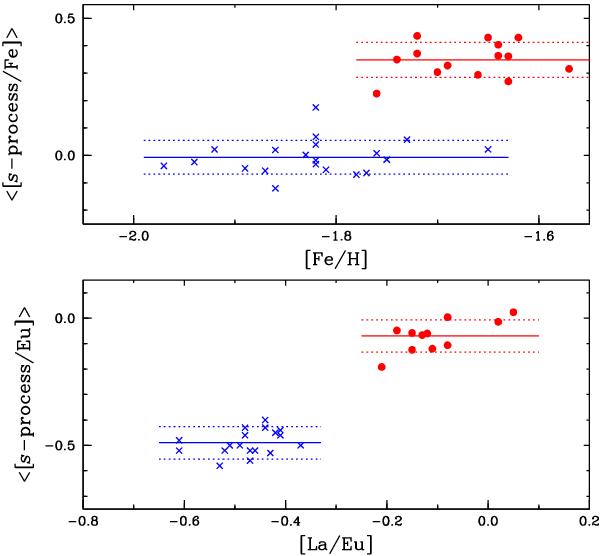
Upper panel: average s-process abundance ratios with respect to Fe, plotted as functions of [Fe/H]. Bottom panel: average s-process abundance ratios with respect to Eu, plotted as functions of [La/Eu]. See the text for how the averages were computed. In each panel, the solid lines represent the means for each group, and the dotted lines represent the sample deviations σ. Symbols are as in Fig. 6.
Current usage metrics show cumulative count of Article Views (full-text article views including HTML views, PDF and ePub downloads, according to the available data) and Abstracts Views on Vision4Press platform.
Data correspond to usage on the plateform after 2015. The current usage metrics is available 48-96 hours after online publication and is updated daily on week days.
Initial download of the metrics may take a while.