Fig. 1
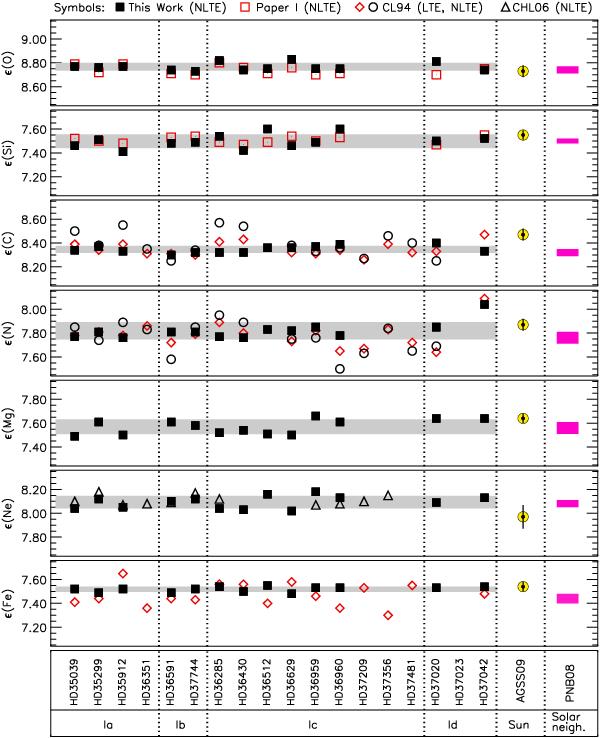
Elemental abundances in our Ori OB1 sample stars and a comparison with previous work, and with common abundance standards. Symbols for data from this work, Paper I, CL94, and CHL06 are explained in the upper part of the figure. The grey-shaded region represents the 1-σ dispersion of abundances from the whole sample of 13 stars. Protosolar values of AGSS09 and the cosmic abundance standard of PNB08 are given on the right-hand side of the figure for comparison.
Current usage metrics show cumulative count of Article Views (full-text article views including HTML views, PDF and ePub downloads, according to the available data) and Abstracts Views on Vision4Press platform.
Data correspond to usage on the plateform after 2015. The current usage metrics is available 48-96 hours after online publication and is updated daily on week days.
Initial download of the metrics may take a while.