Free Access
Fig. 6
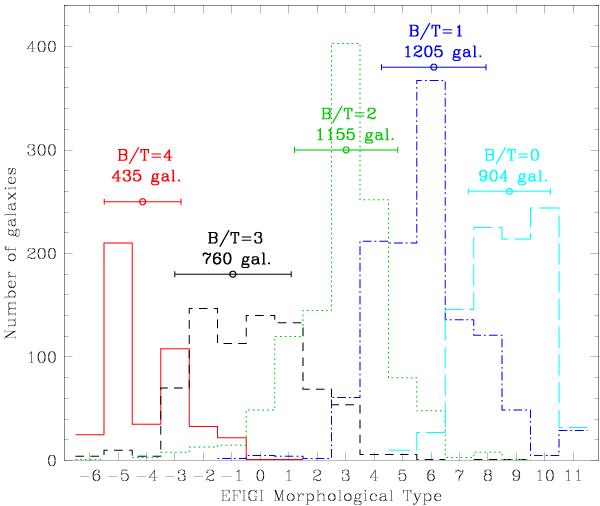
Histograms of EFIGI morphological type for the five values of B/T (decreasing from left to right). The weighted mean and rms dispersion in the morphological type are plotted above each histogram along with the corresponding number of galaxies. This graph shows the large dispersion in morphological type for a given B/T.
Current usage metrics show cumulative count of Article Views (full-text article views including HTML views, PDF and ePub downloads, according to the available data) and Abstracts Views on Vision4Press platform.
Data correspond to usage on the plateform after 2015. The current usage metrics is available 48-96 hours after online publication and is updated daily on week days.
Initial download of the metrics may take a while.