Fig. 25
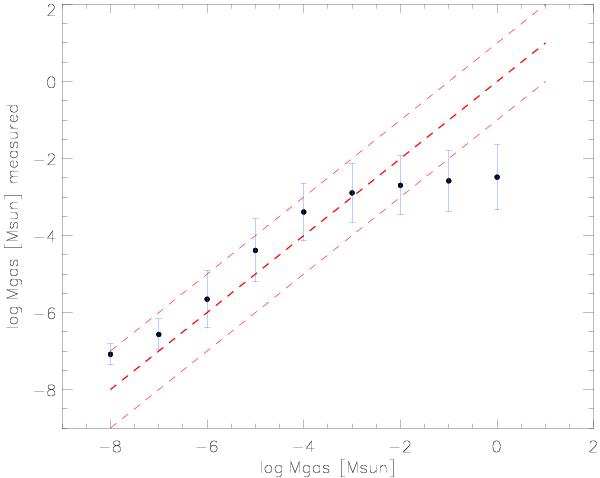
Correlation between the gas mass estimated (or “measured”) from a combination of the [O i] 63 μm line flux and the [O i] 63/CO 2−1 line ratio and the input gas mass of the disc. The blue dots are the mean “measured” gas masses and the error bar denotes the standard deviation. The red solid line is the expected correlation together with the dashed lines that denote an uncertainty of one order of magnitude.
Current usage metrics show cumulative count of Article Views (full-text article views including HTML views, PDF and ePub downloads, according to the available data) and Abstracts Views on Vision4Press platform.
Data correspond to usage on the plateform after 2015. The current usage metrics is available 48-96 hours after online publication and is updated daily on week days.
Initial download of the metrics may take a while.