Fig. 18
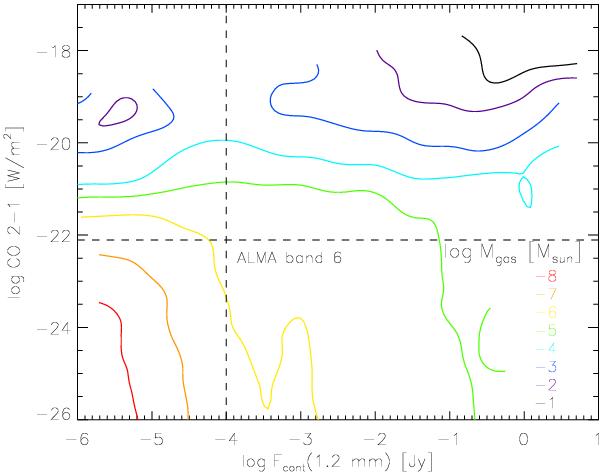
12CO J = 2 − 1 line emission versus continuum flux at 1.2 mm. For discrete intervals in CO line flux and 1.2 mm flux, mean disc masses are calculated from the ensemble of grid models within that bin. The coloured contours show the distribution of these mean disc gas masses. Overplotted are the line and continuum sensitivity limits of ALMA band 6.
Current usage metrics show cumulative count of Article Views (full-text article views including HTML views, PDF and ePub downloads, according to the available data) and Abstracts Views on Vision4Press platform.
Data correspond to usage on the plateform after 2015. The current usage metrics is available 48-96 hours after online publication and is updated daily on week days.
Initial download of the metrics may take a while.