Free Access
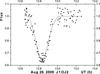
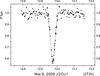
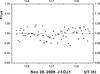
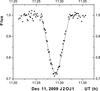
Fig. 3
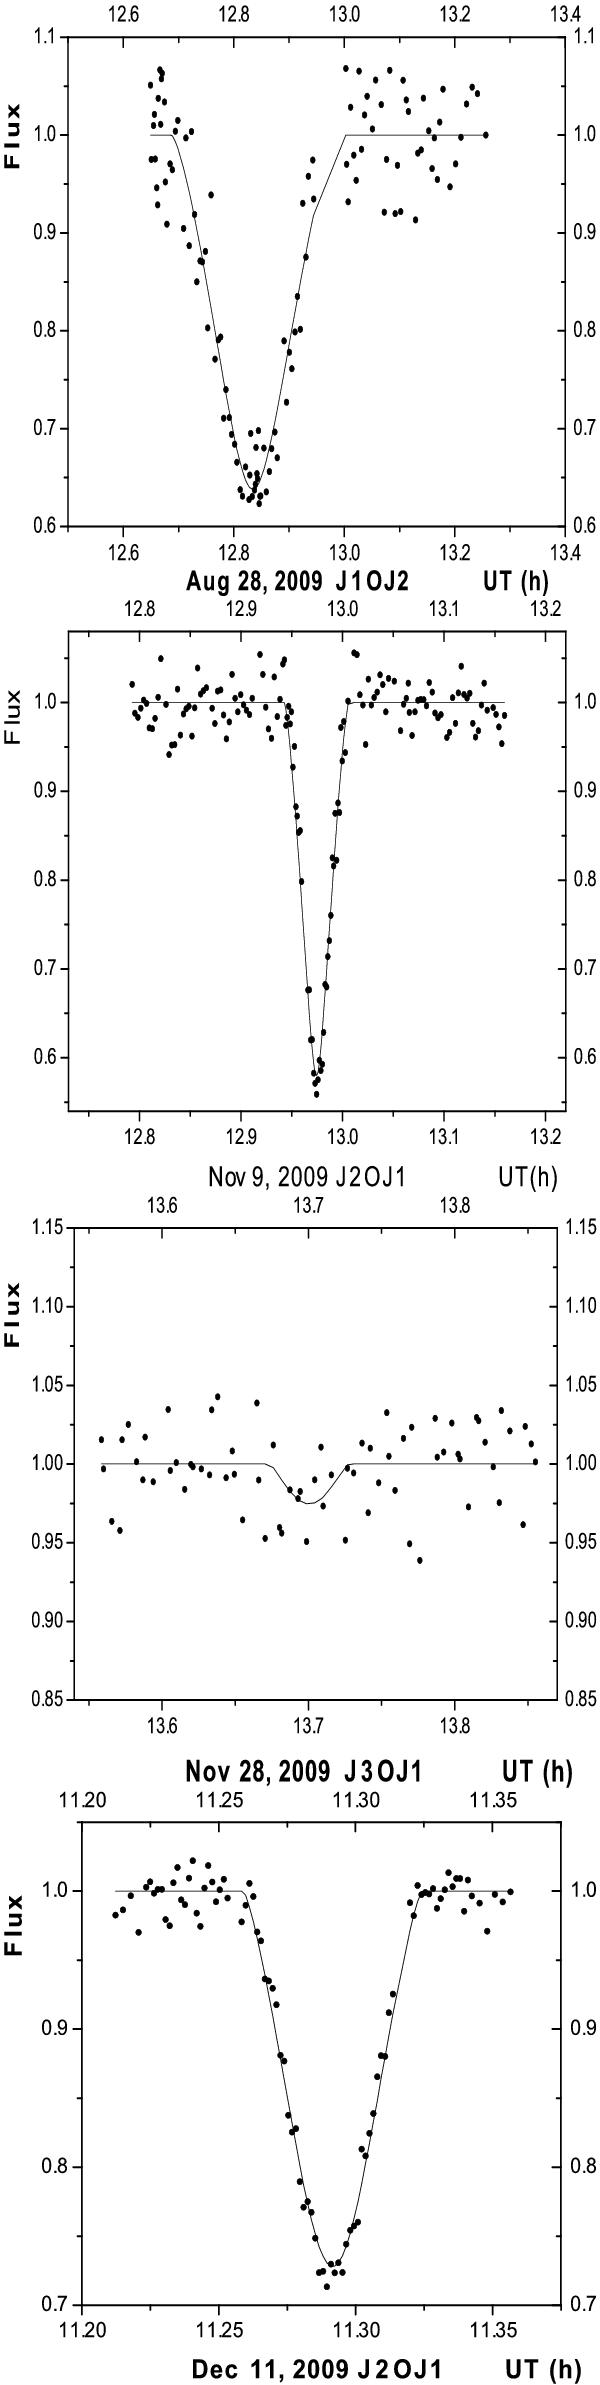
Observed and fitted light curves of involved satellites. The dots and bold lines represent the observed and fitted flux variations of involved satellites normalized to 1 before and after the event, respectively. The x-axis corresponds to the date (in hours) and the y-axis to the relative flux.
This figure is made of several images, please see below:
Current usage metrics show cumulative count of Article Views (full-text article views including HTML views, PDF and ePub downloads, according to the available data) and Abstracts Views on Vision4Press platform.
Data correspond to usage on the plateform after 2015. The current usage metrics is available 48-96 hours after online publication and is updated daily on week days.
Initial download of the metrics may take a while.