Fig. 7
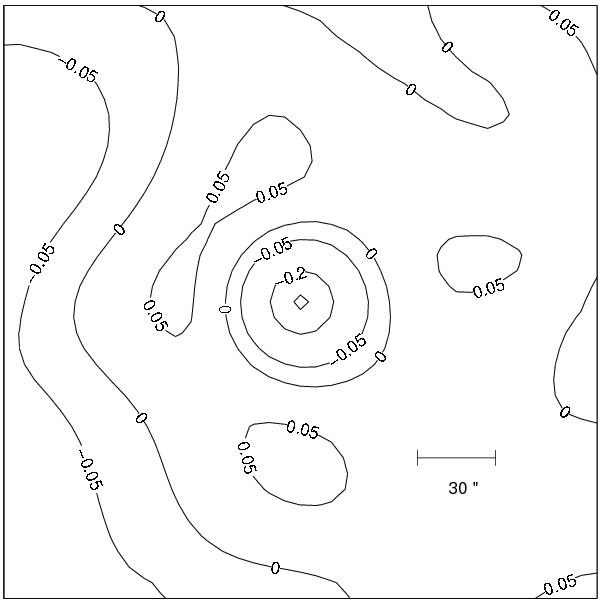
Contour plot of the difference κWL(θ) − κ(θ), where κ(θ) is the true surface mass density of the lens and κWL(θ) is a weak lensing reconstruction of the lens yielding the same total mass. In the central region the reconstructed profile underestimates the surface mass density, while in a significant region of the image plane the opposite case occurs.
Current usage metrics show cumulative count of Article Views (full-text article views including HTML views, PDF and ePub downloads, according to the available data) and Abstracts Views on Vision4Press platform.
Data correspond to usage on the plateform after 2015. The current usage metrics is available 48-96 hours after online publication and is updated daily on week days.
Initial download of the metrics may take a while.