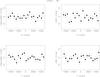
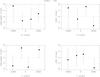
Fig. 1

Mean values of the differences in the sense O–C in right ascension and declination for the reference stars, as a function of the position on the whole acquired field as given by the overlapping images. Bins along the X and Y directions encompass an arc of 2.3′ for the WFI (left panels) and 1.8′ for the SOI (right panels). Each dot represents the mean of at least 100 points for the WFI and 9 points for the SOI. The error bars are standard deviations of the mean and are plotted 1σ above and below the corresponding dot. In these plots, the targets are always found on X = Y = 0.
Current usage metrics show cumulative count of Article Views (full-text article views including HTML views, PDF and ePub downloads, according to the available data) and Abstracts Views on Vision4Press platform.
Data correspond to usage on the plateform after 2015. The current usage metrics is available 48-96 hours after online publication and is updated daily on week days.
Initial download of the metrics may take a while.