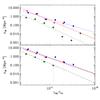
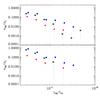
Fig. 12

The IR LFs of three different regions in the A1763 supercluster: core (red dots), filament (blue squares), and outskirts (green stars). 1σ error bars based on 100 bootstrap re-samplings are shown. All IR LFs are corrected for purity and completeness in the corresponding regions. Counts have been multiplied by the fractions of non-AGN galaxies in each LIR-bin and in each region to remove the AGN contribution from the IR LFs. The IR LFs of the upper (respectively, lower) panels have been obtained using the z ∪ zp sample (respectively, z sample) of supercluster members. Left panels show the number densities of IR-emitting galaxies. Lines represent the best-fit power-law functions to the IR LFs. In the right panels, the number densities of IR galaxies have been normalized by the average number densities of galaxies with a r-band luminosity ≥ 7 × 10⁹ L⊙ within each region.
Current usage metrics show cumulative count of Article Views (full-text article views including HTML views, PDF and ePub downloads, according to the available data) and Abstracts Views on Vision4Press platform.
Data correspond to usage on the plateform after 2015. The current usage metrics is available 48-96 hours after online publication and is updated daily on week days.
Initial download of the metrics may take a while.