Fig. 5
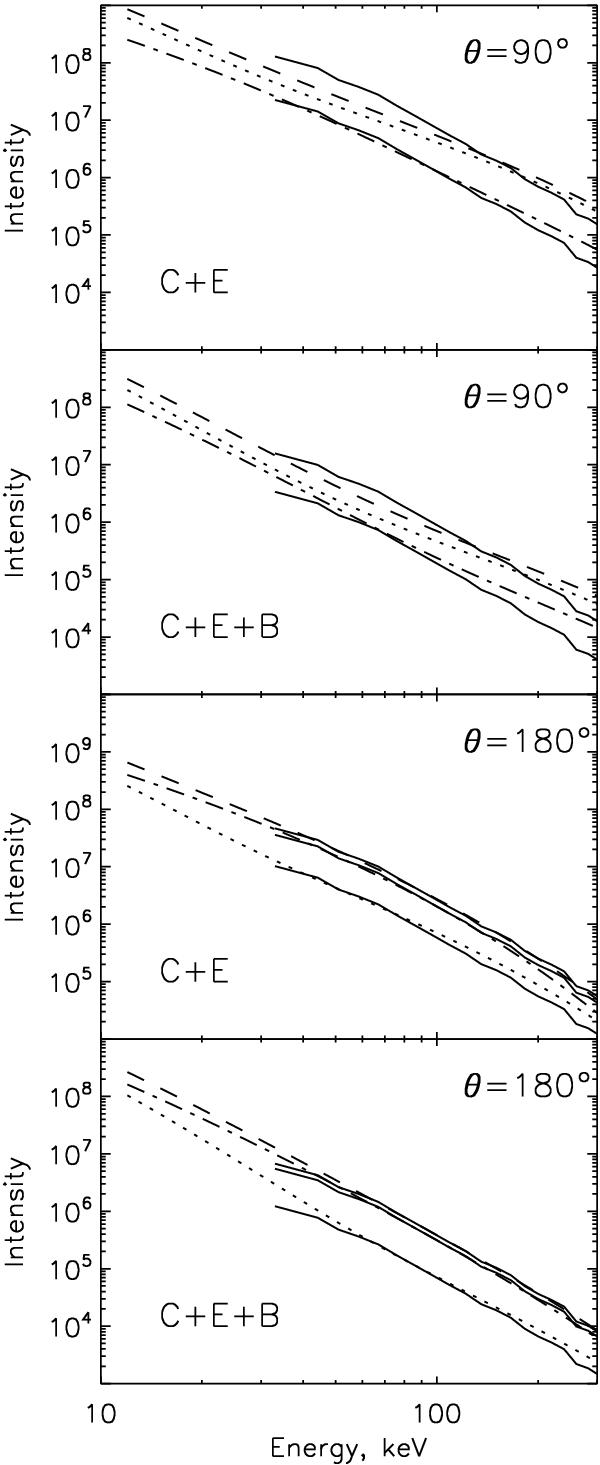
Intensity (in arbitrary units) of the HXR emission spectra calculated from Eq. (7) for different energies, models and propagation directions (0 to 90° for downwards emission and from 90° to 180° for upwards emission). Dash-dotted line: emission from upwards propagating particles; dotted line: from downwards propagating particles, dashed line: total emission (downwards + upwards); solid line: observational data multiplied by the corresponding factors to match the simulated absolute intensities.
Current usage metrics show cumulative count of Article Views (full-text article views including HTML views, PDF and ePub downloads, according to the available data) and Abstracts Views on Vision4Press platform.
Data correspond to usage on the plateform after 2015. The current usage metrics is available 48-96 hours after online publication and is updated daily on week days.
Initial download of the metrics may take a while.