Fig. 3
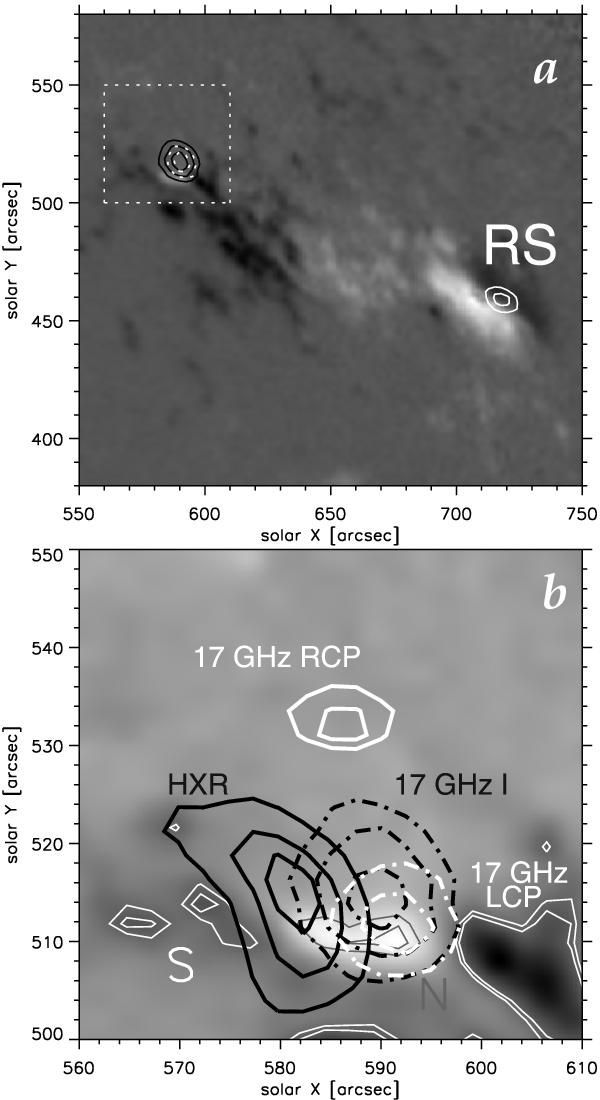
a) Contours of 17 GHz (NoRH, 04:04) flare sources (black solid: Stokes I, 50%, 70%, 90% of the maximum; white solid: Stokes V, RCP, 70%, 90% of the maximum; white dotted: Stokes V, LCP, 70%, 90% of the minimum) superimposed on an MDI magnetogram (04:48:01.61, light areas represent N-polarity, dark areas show S-polarity). The axes show hereafter arc seconds from the solar disk center; b) enlarged flare site denoted in panel a) by the broken frame. Contours of 17 GHz (NoRH, 04:03:40) Contours levels are the same. Black thick contours correspond to the HXR source (Yohkoh/HXT/H; 04:03:40.25; 20%, 50%, 80% of the maximum). Thin solid grey contours mark N-polarity [levels 600, 800 G], and thin white contours mark S-polarity [levels − 600, − 500 G].
Current usage metrics show cumulative count of Article Views (full-text article views including HTML views, PDF and ePub downloads, according to the available data) and Abstracts Views on Vision4Press platform.
Data correspond to usage on the plateform after 2015. The current usage metrics is available 48-96 hours after online publication and is updated daily on week days.
Initial download of the metrics may take a while.