Fig. 10
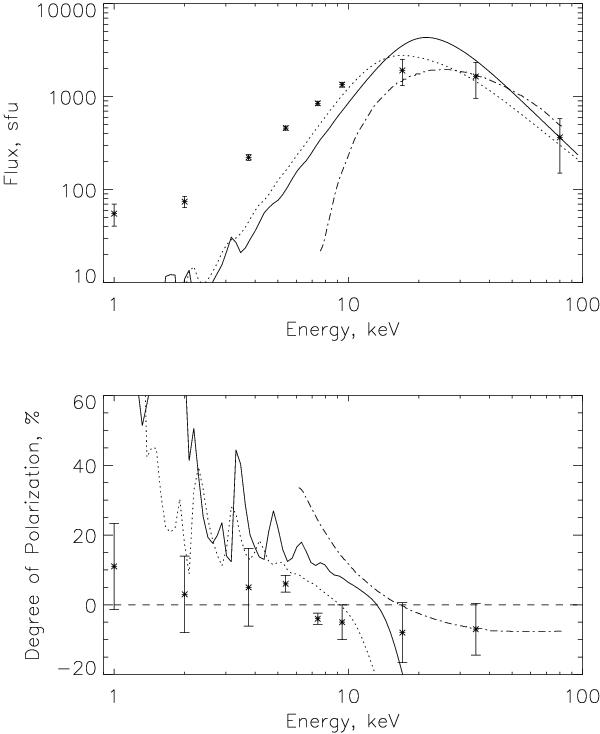
Comparison of observed MW intensity in solar flux units (sfu) (top plot) and degree of polarization (bottom plot) with results of the simulations with CEB2 model for a magnetic field convergence of 2 (dotted line curves) and CEB3 model with convergence of 3 (solid line curves) and the model presented by Altyntsev et al. (2008) (dash-dotted line). In both plots asterisks mark the observed spectra.
Current usage metrics show cumulative count of Article Views (full-text article views including HTML views, PDF and ePub downloads, according to the available data) and Abstracts Views on Vision4Press platform.
Data correspond to usage on the plateform after 2015. The current usage metrics is available 48-96 hours after online publication and is updated daily on week days.
Initial download of the metrics may take a while.