Fig. 9
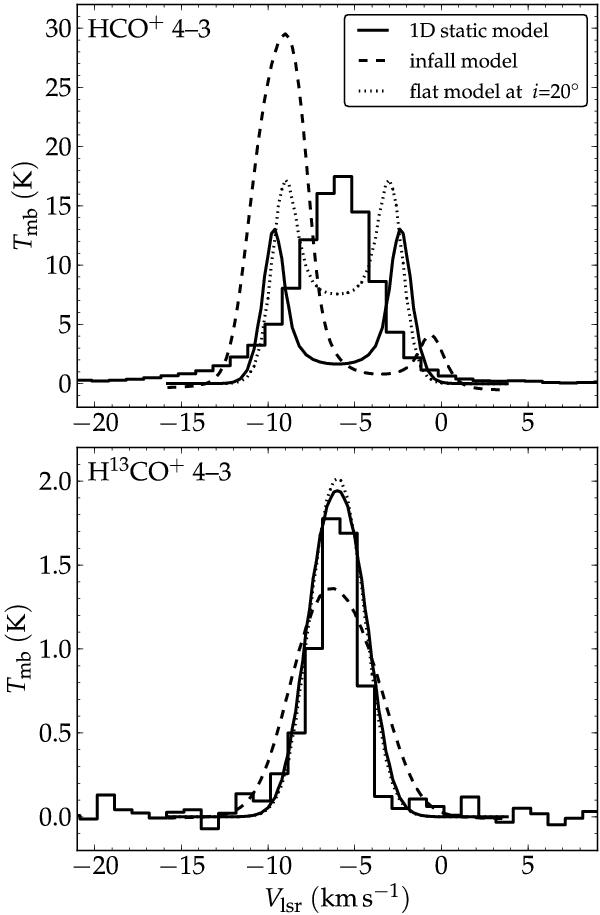
Top: velocity profiles of observed HCO+ 4–3 (histogram), compared to those from various models, all at the central spatial position. The profiles from the spherical (1D) model and the infall model follow from an HCO+ abundance of 1.5 × 10⁻⁸, and the abundance for the model used for the flattened model profile is 6 × 10⁻⁹. Bottom: velocity profiles of observed and modeled H13CO+, with abundances scaled by a factor 60 with respect to H12CO+.
Current usage metrics show cumulative count of Article Views (full-text article views including HTML views, PDF and ePub downloads, according to the available data) and Abstracts Views on Vision4Press platform.
Data correspond to usage on the plateform after 2015. The current usage metrics is available 48-96 hours after online publication and is updated daily on week days.
Initial download of the metrics may take a while.