Fig. 8
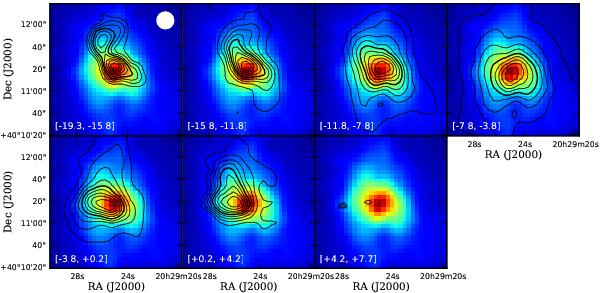
Emission from the 13CO 3–2 transition divided over seven velocity bins. Line intensity is summed over the velocity range indicated in each panel (in km s-1) and represented as black contour lines. Contour levels are 90%, 80%, ..., 10% of the maximum integrated intensity in the velocity bin: 3.9, 14, 41, 124, 50, 8.1, and 0.95 K km s-1 in the respective bins. As in Fig. 2, the 50%-level contour is thicker, and any contours below 0.7 K km s-1 are not drawn. The total integrated 13CO 3–2 line intensity over the entire velocity range is shown in color scale in each panel, for reference.
Current usage metrics show cumulative count of Article Views (full-text article views including HTML views, PDF and ePub downloads, according to the available data) and Abstracts Views on Vision4Press platform.
Data correspond to usage on the plateform after 2015. The current usage metrics is available 48-96 hours after online publication and is updated daily on week days.
Initial download of the metrics may take a while.