Fig. 7
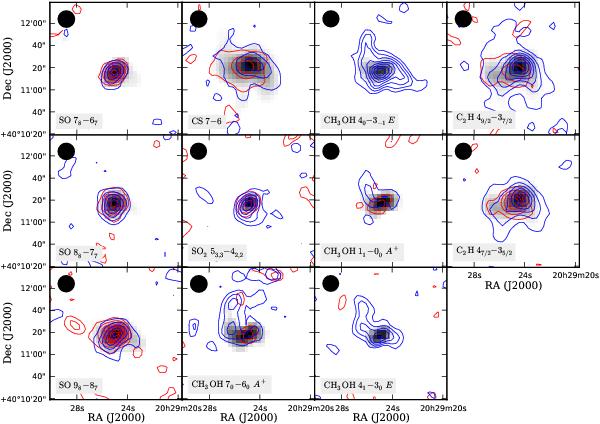
Channel maps for sulfur-bearing species, CH3OH, and C2H. Colors and contours have the same meaning as in Fig. 6, except lowest contours: 0.6 K km s-1 for SO 78–67, 0.4 K km s-1 for SO 88–87 and 98–87, 0.6 K km s-1 for CS 7–6, 0.2 K km s-1 for SO2 53,3–42,2, 0.35, 0.6, 0.35 and 0.3 K km s-1 for the four consecutive CH3OH transitions, and 0.4 K km s-1 for both C2H transitions.
Current usage metrics show cumulative count of Article Views (full-text article views including HTML views, PDF and ePub downloads, according to the available data) and Abstracts Views on Vision4Press platform.
Data correspond to usage on the plateform after 2015. The current usage metrics is available 48-96 hours after online publication and is updated daily on week days.
Initial download of the metrics may take a while.