Fig. 6
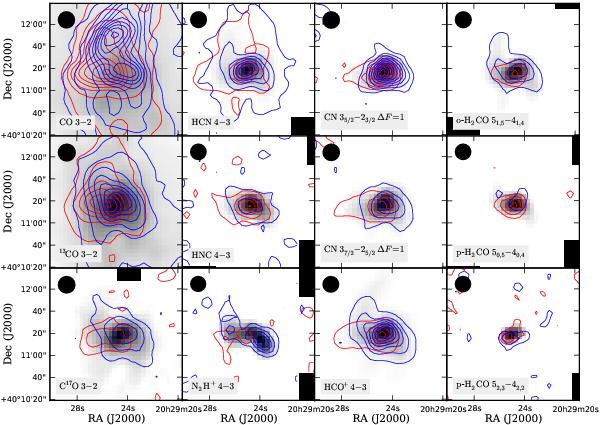
Channel maps for the CO isotopologs, N-bearing species, HCO+ and H2CO. The velocity range is divided in three velocity bins with respect to the systemic velocity of −5.8 km s-1: [−1.5, + 1.5] km s-1 is shown in gray scale stretched between 0.7 K km s-1 (white) and the maximum intensity in the central channel (black); all emission at relative velocities below −1.5 km s-1 is shown in blue contours, and all emission at relative velocities above +1.5 km s-1 in red contours. The lowest contour level is manually fine-tuned to emphasize velocity structure in each case without showing too much noise. Consecutive contour levels are drawn in steps of 10% of the maximum intensity in the brightest channel. Lowest contours: 15.0 K km s-1 for CO, 5.0 K km s-1 for 13CO, 0.8 K km s-1 for C17O, 0.35 K km s-1 for HCN and HNC, 0.4 K km s-1 for N2H+, 0.8 K km s-1 for CN 35/2–23/2, 1.0 K km s-1 for CN 37/2–25/2, and 0.8, 0.4 and 0.3 K km s-1 for the three respective H2CO transitions. The FWHM of the telescope beam is indicated in the top left corner of each panel.
Current usage metrics show cumulative count of Article Views (full-text article views including HTML views, PDF and ePub downloads, according to the available data) and Abstracts Views on Vision4Press platform.
Data correspond to usage on the plateform after 2015. The current usage metrics is available 48-96 hours after online publication and is updated daily on week days.
Initial download of the metrics may take a while.