Fig. 13
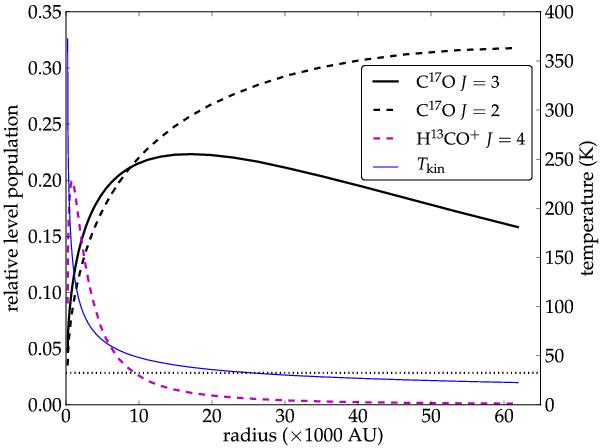
Relative level populations of the J = 3 and J = 2 levels of C17O, and the J = 4 level of H13CO+, as determined by the Monte Carlo method in ratran for the static spherical model. The population of each J level is given relative to the total population for that species. The gas temperature profile (Tkin) of the model cloud is shown by the solid blue line. The energy level of the J = 3 rotational state of C17O is indicated by the dotted horizontal line.
Current usage metrics show cumulative count of Article Views (full-text article views including HTML views, PDF and ePub downloads, according to the available data) and Abstracts Views on Vision4Press platform.
Data correspond to usage on the plateform after 2015. The current usage metrics is available 48-96 hours after online publication and is updated daily on week days.
Initial download of the metrics may take a while.