Fig. 12
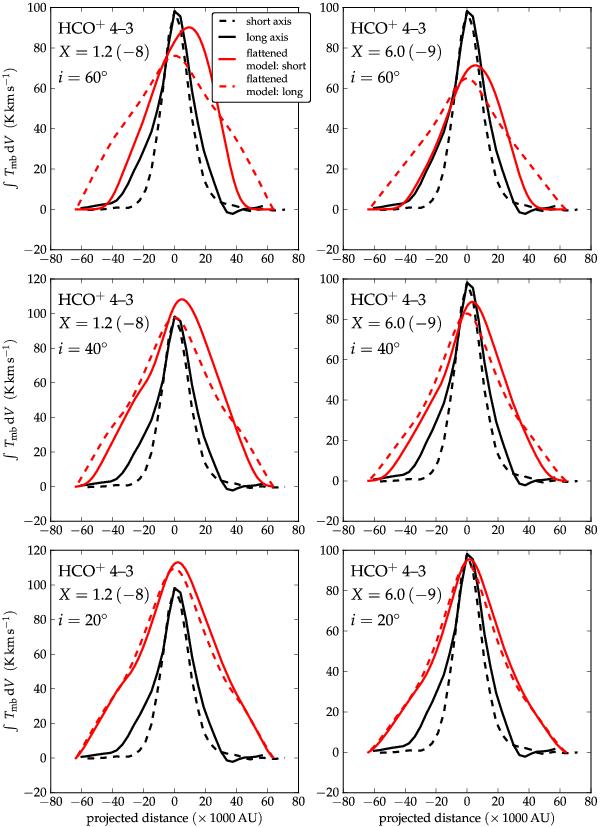
Position dependence of integrated line intensities for HCO+ 4–3, compared with integrated line intensity profiles from flattened ellipsoidal physical models (Sect. 4.5). Model slices are shown for an HCO+ abundance of 1.2 × 10⁻⁸ (left column) and 6 × 10⁻⁹ (right column). The viewing angle i varies from 60° (top) to 40° (middle) to 20° (bottom). Values of optical depth at line center through the center of the model, as determined by the ray tracing routine, are for X = 1.2 × 10⁻⁸: 42, 28, 23 at i = 60,40,20°, respectively; and for X = 6 × 10⁻⁹: 23, 15, 13 at i = 60,40,20°, respectively.
Current usage metrics show cumulative count of Article Views (full-text article views including HTML views, PDF and ePub downloads, according to the available data) and Abstracts Views on Vision4Press platform.
Data correspond to usage on the plateform after 2015. The current usage metrics is available 48-96 hours after online publication and is updated daily on week days.
Initial download of the metrics may take a while.