Fig. 10
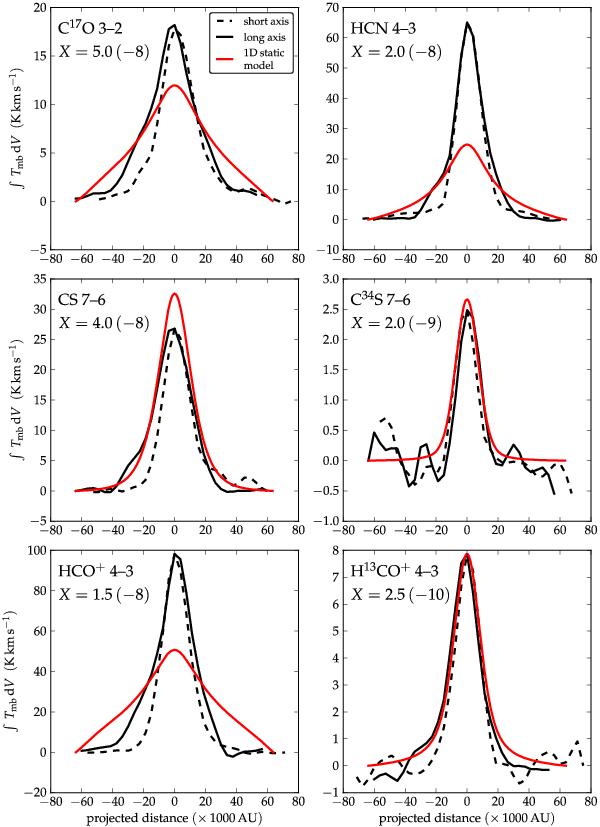
Position dependence of integrated line intensities for static spherical ratran models (Sect. 4.2) of C17O, HCN, CS, C34S, HCO+ and H13CO+. Black solid and dashed lines represent two perpendicular slice directions in the observed maps, red lines represent radial dependence of integrated line strength in the 1D static models. At the line center, the sky ray tracing routine calculates the following optical depths through the center of the model sphere: 0.095 for C17O, 33 for HCN, 10 for CS, 0.38 for C34S, 34 for HCO+ and 0.64 for H13CO+. Abundance values (X) are presented in the form a (b), representing a × 10b.
Current usage metrics show cumulative count of Article Views (full-text article views including HTML views, PDF and ePub downloads, according to the available data) and Abstracts Views on Vision4Press platform.
Data correspond to usage on the plateform after 2015. The current usage metrics is available 48-96 hours after online publication and is updated daily on week days.
Initial download of the metrics may take a while.