| Issue |
A&A
Volume 532, August 2011
|
|
|---|---|---|
| Article Number | A58 | |
| Number of page(s) | 4 | |
| Section | Planets and planetary systems | |
| DOI | https://doi.org/10.1051/0004-6361/201016058 | |
| Published online | 21 July 2011 | |
Atmospheric studies of habitability in the Gliese 581 system
1
Institut für Planetenforschung, Deutsches Zentrum für Luft- und Raumfahrt, Rutherfordstr. 2, 12489 Berlin, Germany
e-mail: This email address is being protected from spambots. You need JavaScript enabled to view it.
2
Zentrum für Astronomie und Astrophysik, Technische Universität Berlin, Hardenbergstr. 36, 10623 Berlin, Germany
Received: 3 November 2010
Accepted: 18 April 2011
Abstract
Context. The M-type star Gliese 581 is orbited by at least one terrestrial planet candidate in the habitable zone, i.e. GL 581 d. Orbital simulations have shown that additional planets inside the habitable zone of GL 581 would be dynamically stable. Recently, two other planet candidates have been claimed, one of them in the habitable zone.
Aims. In view of the ongoing search for planets around M stars that is expected to result in numerous detections of potentially habitable super-Earths, we take the GL 581 system as an example for investigating such planets. In contrast to previous studies of habitability in the GL 581 system, we use a consistent atmospheric model to assess surface conditions and habitability. Furthermore, we performed detailed atmospheric simulations for a much larger subset of potential planetary and atmospheric scenarios than previously considered.
Methods. A 1D radiative-convective atmosphere model was used to calculate temperature and pressure profiles of model atmospheres, which we assumed to be composed of molecular nitrogen, water, and carbon dioxide. In these calculations, key parameters such as surface pressure and CO2 concentration, as well as orbital distance and planetary mass are varied.
Results. Results imply that surface temperatures above freezing could be obtained, independent of the atmospheric scenarios considered here, at an orbital distance of 0.117 AU. For an orbital distance of 0.146 AU, CO2 concentrations as low as 10 times the present Earth’s value are sufficient to warm the surface above the freezing point of water. At 0.175 AU, only scenarios with CO2 concentrations of 5% and 95% were found to be habitable, so an additional super-Earth planet in the GL 581 system in the previously determined dynamical stability range would be considered a potentially habitable planet.
Key words: astrobiology / planets and satellites: atmospheres / planetary systems / stars: individual: Gliese 581
© ESO, 2011
1. Introduction
The discovery and characterization of extrasolar terrestrial planets in the habitable zone (HZ) of their central star is one of the most exciting prospects of exoplanetary science. Such planets are extremely good candidates for the search for extraterrestrial life. The HZ is usually defined as the shell around a star where a planet could retain liquid water on the surface (Kasting et al. 1993). This definition is justified because liquid water seems to be the fundamental requirement for life as we know it on Earth. Being located inside the HZ as defined by Kasting et al. (1993), for an Earth-like planet, however, does not necessarily imply habitability for a specific planetary scenario (see, e.g., Mars in our own solar system). The potential habitability of a planet is critically dependent on atmospheric composition and surface pressure. Still, for a planet located well inside this classical HZ, habitability is achievable for a much broader range of atmospheric conditions (greenhouse effect, etc.) than for a planet near one of the boundaries.
Among the more than 500 extrasolar planets discovered so far, some orbit their central star inside or near the HZ (e.g., Mayor et al. 2004; Lovis et al. 2006; Fischer et al. 2008; Haghighipour et al. 2010). Most of these planets are Neptune- or Jupiter-like gas planets. The planetary system Gliese 581 (GL 581), however, contains at least four planets (Bonfils et al. 2005; Udry et al. 2007; Mayor et al. 2009), one of which is a potentially habitable super-Earth, GL 581 d. This was shown by Wordsworth et al. (2010), von Paris et al. (2010), Hu & Ding (2011) and Kaltenegger et al. (2011) who presented 1D modeling studies of different atmospheric scenarios of GL 581 d. They find habitable surface conditions (i.e., surface temperatures above 273 K) with CO2 partial pressures as low as 1 bar, depending on CO2 concentration. These results imply that the GL 581 planetary system indeed contains at least one potentially habitable, possibly terrestrial planet.
Orbital simulations presented by Zollinger & Armstrong (2009) show that, between the orbits of GL 581 c and d (i.e., inside the classical HZ), another super-Earth planet would be dynamically stable. Specifically, they stated a stability range for a low-eccentricity planet of not more than 2.6 Earth masses (m ⊕ ) ranging from 0.126 AU to 0.17 AU.
Recently, Vogt et al. (2010) have claimed the detection of two more planets in the GL 581 system, one of them (called GL 581 g in Vogt et al. 2010) with a minimum mass of 3.1 m⊕ and an orbital distance of 0.146 AU, hence inside the stability range calculated by Zollinger & Armstrong (2009). These detections are controversial and disputed by later analysis of the radial velocity data (Tuomi 2011).
Nevertheless, we use this claimed discovery as a starting point to investigate the habitability of planets in the GL 581 system. Such model calculations aim at supporting the selection of future targets for detailed observational programs of habitable planets. This selection is probably needed in the future (Horner & Jones 2010), given the expected number of targets. Such potentially habitable planets are expected to be discovered in the near future by on-going ground-based programs such as MEarth (Nutzman & Charbonneau 2008), space missions like Kepler (see, e.g., Borucki et al. 2011, for an overview of Kepler candidates), and the planned PlaTO mission (Catala 2009). First attempts at characterizing the atmospheres of transiting super-Earth planets have already been made (CoRoT-7 b, Guenther et al. 2011; and GJ 1214 b, Bean et al. 2010; Désert et al. 2011; Croll et al. 2011).
For the claimed planet in the HZ of GL 581, there have been dedicated modeling studies by Pierrehumbert (2011), Heng & Vogt (2010) and von Bloh et al. (2011). Pierrehumbert (2011) presents several possible atmospheric scenarios (airless planet, pure N2, mixed CO2/H2O atmospheres) and discusses potential implications for surface conditions, without detailed calculations of the atmospheric structure for the mixed CO2/H2O cases. On the other hand, Heng & Vogt (2010) use a general circulation model of Earth to simulate the dynamics and circulation on GL 581 g, but did not investigate surface conditions and habitability in detail. The study of von Bloh et al. (2011) uses a geodynamic box model to assess planetary habitability, coupling geophysical and atmospheric processes in a simplified approach.
Previous modeling studies of habitability in the GL 581 system have either focused on the existing planets GL 581 c and d (e.g., Selsis et al. 2007; von Bloh et al. 2007), used a very simple model to simulate atmospheric processes and surface conditions (e.g., von Bloh et al. 2011), or investigated only a very small subset of potential atmospheric scenarios in terms of CO2 level and surface pressure when varying orbital distance (Kaltenegger et al. 2011). We present here model calculations for possible terrestrial planets in the GL 581 system along the same line of reasoning as in von Paris et al. (2010), using a consistent 1D atmosphere model. We vary the surface pressure and CO2 level over a large range. For these scenarios, we calculate temperature and pressure profiles in order to assess the habitability of so far hypothetical planets, assuming different planetary masses and orbital distances.
The paper is organized as follows: Sect. 2 states the stellar and planetary parameters. The model used is described in Sect. 3. A description of the runs is given in Sect. 4. Results are described and discussed in Sect. 5. We give our conclusions in Sect. 6.
2. Model planets around GL 581
GL 581 is a very quiet M3 star (Bonfils et al. 2005). The stellar spectrum of GL 581 is taken from von Paris et al. (2010). It was derived from an UV spectrum measured by the IUE (International Ultraviolet Explorer) satellite and a synthetic Nextgen model spectrum (Hauschildt et al. 1999).
Atmospheric simulations were performed for a subset of probable planet scenarios, defined by mass and orbital distance. We varied the orbital distance from 0.117 to 0.175 AU, covering the stability range found by Zollinger & Armstrong (2009). In terms of insolation in the solar system, this translates roughly into the present-day insolation at the orbit of Mars and the solar flux at Earth about 1.3 billion years ago (e.g., Gough 1981). The planetary mass was varied between 2.6 and 3.1 m ⊕ . For all scenarios, orbits were assumed to be circular.
The planetary radius is taken from a mass-radius relationship by Sotin et al. (2007) and yields the surface gravity. Changing the planetary mass from 3.1 to 2.6 m ⊕ decreases the gravity from 16.4 m s-2 to 15.1 m s-2, i.e. by roughly 9%.
As in von Paris et al. (2010), the measured Earth surface albedo, i.e. the reflectivity of the planetary surface with respect to incoming stellar radiation, was taken as the model surface albedo (Asurf = 0.13, Rossow & Schiffer 1999) for all scenarios. In doing so, the effect of clouds is explicitly excluded from our simulations. Table 1 summarizes the planetary parameters. Scenario 2 in Table 1 corresponds to the claimed planet GL 581 g of Vogt et al. (2010).
Planetary parameters.
3. Atmospheric model
A cloud-free 1D radiative-convective model was used to calculate the atmospheric structure, i.e. the temperature, water and pressure profiles. The model was originally based on the climate model described by Kasting et al. (1984a) and Kasting et al. (1984b). Further developments are described by e.g. Kasting (1988) and Mischna et al. (2000). The model version used here is based on the version of von Paris et al. (2008) and von Paris et al. (2010) where more details on the model are given.
The model considers N2, H2O, and CO2 as atmospheric species. H2O and CO2 are the two most important greenhouse gases on present Earth, and N2 is present in significant amounts in all terrestrial atmospheres of the solar system.
Temperature profiles from the surface up to a pressure of 6.6 × 10⁻⁵ bar are calculated by solving the equation of radiative transfer and performing convective adjustment, if necessary. Convective adjustment means that the lapse rate in the atmosphere is adjusted to the convective lapse rate instead of using the radiative lapse rate if the atmosphere is unstable against convection. The convective lapse rate is assumed to be adiabatic with contributions of latent heat release by condensing water or carbon dioxide. The water profile is calculated based on the relative humidity distribution of Manabe & Wetherald (1967). Above the cold trap, the water profile is set to an isoprofile of the cold trap value.
4. Atmospheric scenarios
We performed a parameter study to investigate the influence of surface pressure and CO2 level on the potential habitability of terrestrial planets in the GL 581 system, as summarized in Table 1. The initial surface pressure (1, 2, 5, 10, 20 bar) and CO2 concentration (0.95, 0.05, 3.55 × 10⁻³ and 355 ppm, respectively) were varied. N2 was used as the background gas. Table 2 summarizes the considered atmospheric scenarios.
Atmospheric scenarios (PAL: present atmospheric level).
5. Results and discussion
5.1. Temperature profiles
The resulting temperature-pressure profiles of scenario 2 in Table 1 for the sets G1-G4 are shown in Figs. 1–4. The equilibrium temperature Teq of the planet and the melting temperature of water (273 K) are indicated. A global mean surface temperature of 273 K or higher is generally used as the criterion for surface habitability in exoplanet science. This criterion is based purely on the phase diagram of water where the liquid phase of water needs temperatures above 273 K at almost all pressures (the melting line is nearly isothermal in the p-T diagram). Of course, on Earth life is found in areas with mean annual temperatures far below the freezing point of water.
The low CO2 runs result in uninhabitable surface conditions for all assumed surface pressures (see Fig. 1), although the 20 bar run with a surface temperature of 272 K is very close to being considered habitable.
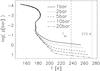 |
Fig. 1 Temperature-pressure profiles for the low CO2 (355 ppm CO2) runs of scenario 2. Equilibrium temperature of the planet (dashed) and melting temperature of water (dotted) are indicated as vertical lines. |
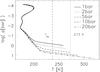 |
Fig. 2 Temperature-pressure profiles for the 10 PAL CO2 (3.55 × 10⁻³ CO2) runs of scenario 2. |
When increasing the CO2 content by a factor of 10, calculated surface temperatures ranged between 258 and 320 K (Fig. 2). For surface pressures of 5 bars or more, surface temperatures were higher than 273 K, indicating potentially habitable surface conditions. The rather high surface temperature of 320 K for the 20 bar run is the result of the stronger greenhouse effect due to CO2 and a positive water vapor feedback (increasing surface temperature leads to increased water vapor in the atmosphere, hence more greenhouse effect).
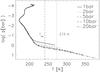 |
Fig. 3 Temperature-pressure profiles for the medium CO2 (5% CO2) runs of scenario 2. |
The medium CO2 runs (see Fig. 3) result in habitable conditions on the surface for pressures of 2 bars and higher. Calculated surface temperatures are as high as 378 K for the 20 bar case.
The high CO2 runs (see Fig. 4) all show habitable conditions on the surface. Calculated surface temperatures range from 290 to 401 K upon increasing the surface pressure from 1 to 20 bars.
In all runs presented here, model atmospheres show convective tropospheres and radiative stratospheres, in contrast to the purely radiative atmospheres encountered in some cases in von Paris et al. (2010). Also, CO2 condensation is absent for all runs, even in the high CO2 cases, owing to the high temperatures in the middle atmosphere.
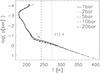 |
Fig. 4 Temperature-pressure profiles for the high CO2 (95% CO2) runs of scenario 2. |
5.2. Variation in gravity
The main effect upon decreasing the gravity g at fixed surface pressure ps is an increase in column density Dcol (since  ). This then translates into more of a greenhouse effect, meaning that the first-order influence of decreasing gravity will be an increase in surface temperature. However, for the small variations in gravity considered here (see Sect. 2), the resulting increase in surface temperatures only ranged from of 0.4 to 2.8 K. Such small variations in surface temperatures are not critical in the assessment of habitability in the frame of this work, so are not shown.
5.3. Variation in orbital distance
The immediate effect of increasing the orbital distance is a reduction of the stellar flux S received by the planet, so that the amount of CO2 required to achieve surface temperatures above 273 K increases with orbital distance.
In Table 3, we show the surface temperatures as a function of surface pressure and CO2 concentration for the scenarios 1–3 in Table 1. It is clearly seen that for an orbital distance of 0.117 AU even the low CO2 runs result in habitable surface conditions over the entire range of surface pressures considered. It can also be inferred that the same value of surface temperature can be achieved for several combinations of surface pressure and CO2 concentration.
As already demonstrated by the temperature profiles shown above, for an orbital distance of 0.146 AU, several model scenarios resulted in surface conditions that were uninhabitable (e.g., Fig. 1). However, in general, habitability can be achieved over the entire range of CO2 concentrations with accordingly high surface pressures.
Surface temperature in K for variations in orbital distance d, surface pressure p in bar, and CO2 concentration C.
Also towards the outer boundary of the HZ around GL 581, at an orbital distance of 0.175 AU, habitable scenarios could be found. However, allowed CO2 concentrations for surface temperatures above freezing are now limited to the medium and high CO2 cases. Model scenarios with less CO2 were found to be uninhabitable, independent of surface pressure. These results confirm the findings of von Paris et al. (2010) that medium CO2 scenarios need to be taken into account when assessing the habitability of planets orbiting near the outer boundary of the habitable zone.
6. Conclusions
We presented 1D radiative-convective calculations for a subset of potential atmospheric conditions on hypothetical super-Earth planets orbiting GL 581. We varied parameters such as orbital distance, CO2 concentration and surface pressure. In contrast to previous studies of habitability in the GL 581 system, we considered a much larger parameter space and used a consistent atmospheric model to assess surface conditions.
Our results imply that habitable surface conditions (here Tsurf > 273 K) could be obtained for a large part of the considered parameter space. For the smallest orbital distance of 0.117 AU, habitability was achieved independently of the considered atmospheric parameter range. For an orbital distance of 0.146 AU, depending on surface pressure, CO2 concentrations as low as ten times the present Earth’s value were found to be sufficient for surface habitability. However, for the largest orbital distance considered (0.175 AU), surface conditions were only habitable with CO2 concentrations of 5% and more. As a result, our simulations show that an additional super-Earth planet in the GL 581 system in the dynamical stability range calculated by Zollinger & Armstrong (2009) would indeed be considered a potentially habitable planet.
The model calculations presented here for a subset of the possible parameter space (orbital distance, CO2 concentration, surface pressure) illustrate how such investigations can be helpful for selecting potentially habitable planets for further, more detailed studies from a future larger sample of known super-Earths.
Acknowledgments
This research has been supported by the Helmholtz Gemeinschaft through the research alliance “Planetary Evolution and Life”. Helpful discussions with J. W. Stock, J. L. Grenfell, A. B. C. Patzer and A. Hölscher are gratefully acknowledged. We thank the anonymous referee and Tristan Guillot for their comments that helped clarify the paper.
References
- Bean, J. L., Kempton, E., & Homeier, D. 2010, Nature, 468, 669 [NASA ADS] [CrossRef] [PubMed] [Google Scholar]
- Bonfils, X., Forveille, T., Delfosse, X., et al. 2005, A&A, 443, L15 [NASA ADS] [CrossRef] [EDP Sciences] [Google Scholar]
- Borucki, W. J., Koch, D. G., Basri, G., et al. 2011, ApJ, submitted [Google Scholar]
- Catala, C. 2009, Exper. Astron., 23, 329 [Google Scholar]
- Croll, B., Albert, L., Jayawardhana, R., et al. 2011, ApJ, accepted [Google Scholar]
- Désert, J., Bean, J., Miller-Ricci Kempton, E., et al. 2011, ApJ, 731, L40 [NASA ADS] [CrossRef] [Google Scholar]
- Fischer, D. A., Marcy, G. W., Butler, R. P., et al. 2008, ApJ, 675, 790 [NASA ADS] [CrossRef] [Google Scholar]
- Gough, D. O. 1981, Sol. Phys., 74, 21 [Google Scholar]
- Guenther, E. W., Cabrera, J., Erikson, A., et al. 2011, A&A, 525, A24 [NASA ADS] [CrossRef] [EDP Sciences] [Google Scholar]
- Haghighipour, N., Vogt, S. S., Butler, R. P., et al. 2010, ApJ, 715, 271 [NASA ADS] [CrossRef] [Google Scholar]
- Hauschildt, P. H., Allard, F., & Baron, E. 1999, ApJ, 512, 377 [NASA ADS] [CrossRef] [Google Scholar]
- Heng, K., & Vogt, S. S. 2010, MNRAS, accepted [Google Scholar]
- Horner, J., & Jones, B. W. 2010, Int. J. Astrobiol., 9, 273 [CrossRef] [Google Scholar]
- Hu, Y., & Ding, F. 2011, A&A, 526, A135 [NASA ADS] [CrossRef] [EDP Sciences] [Google Scholar]
- Kaltenegger, L., Segura, A., & Mohanty, S. 2011, ApJ, 733, 35 [NASA ADS] [CrossRef] [Google Scholar]
- Kasting, J. F. 1988, Icarus, 74, 472 [NASA ADS] [CrossRef] [PubMed] [Google Scholar]
- Kasting, J. F., Pollack, J. B., & Ackerman, T. P. 1984a, Icarus, 57, 335 [NASA ADS] [CrossRef] [Google Scholar]
- Kasting, J. F., Pollack, J. B., & Crisp, D. 1984b, J. Atmosph. Chem., 1, 403 [Google Scholar]
- Kasting, J. F., Whitmire, D. P., & Reynolds, R. T. 1993, Icarus, 101, 108 [NASA ADS] [CrossRef] [PubMed] [Google Scholar]
- Lovis, C., Mayor, M., Pepe, F., et al. 2006, Nature, 441, 305 [NASA ADS] [CrossRef] [PubMed] [Google Scholar]
- Manabe, S., & Wetherald, R. T. 1967, J. Atm. Sci., 24, 241 [NASA ADS] [CrossRef] [Google Scholar]
- Mayor, M., Udry, S., Naef, D., et al. 2004, A&A, 415, 391 [NASA ADS] [CrossRef] [EDP Sciences] [Google Scholar]
- Mayor, M., Bonfils, X., Forveille, T., et al. 2009, A&A, 507, 487 [NASA ADS] [CrossRef] [EDP Sciences] [Google Scholar]
- Mischna, M. A., Kasting, J. F., Pavlov, A., & Freedman, R. 2000, Icarus, 145, 546 [NASA ADS] [CrossRef] [PubMed] [Google Scholar]
- Nutzman, P., & Charbonneau, D. 2008, PASP, 120, 317 [NASA ADS] [CrossRef] [Google Scholar]
- Pierrehumbert, R. T. 2011, ApJ, 726, L8 [NASA ADS] [CrossRef] [Google Scholar]
- Rossow, W. B., & Schiffer, R. A. 1999, Bull. Amer. Meteor. Soc., 80, 2261 [Google Scholar]
- Selsis, F., Kasting, J. F., Levrard, B., et al. 2007, A&A, 476, 1373 [NASA ADS] [CrossRef] [EDP Sciences] [Google Scholar]
- Sotin, C., Grasset, O., & Mocquet, A. 2007, Icarus, 191, 337 [NASA ADS] [CrossRef] [Google Scholar]
- Tuomi, M. 2011, A&A, 528, L5 [NASA ADS] [CrossRef] [EDP Sciences] [Google Scholar]
- Udry, S., Bonfils, X., Delfosse, X., et al. 2007, A&A, 469, L43 [NASA ADS] [CrossRef] [EDP Sciences] [Google Scholar]
- Vogt, S. S., Butler, R. P., Rivera, E. J., et al. 2010, ApJ, 723, 954 [NASA ADS] [CrossRef] [EDP Sciences] [Google Scholar]
- von Bloh, W., Bounama, C., Cuntz, M., & Franck, S. 2007, A&A, 476, 1365 [NASA ADS] [CrossRef] [EDP Sciences] [Google Scholar]
- von Bloh, W., Cuntz, M., Franck, S., & Bounama, C. 2011, A&A, 528, A133 [NASA ADS] [CrossRef] [EDP Sciences] [Google Scholar]
- von Paris, P., Rauer, H., Grenfell, J. L., et al. 2008, Planet. Space Science, 56, 1244 [Google Scholar]
- von Paris, P., Gebauer, S., Godolt, M., et al. 2010, A&A, 522, A23 [NASA ADS] [CrossRef] [EDP Sciences] [Google Scholar]
- Wordsworth, R., Forget, F., Selsis, F., et al. 2010, A&A, 522, A22 [NASA ADS] [CrossRef] [EDP Sciences] [Google Scholar]
- Zollinger, R., & Armstrong, J. C. 2009, A&A, 497, 583 [NASA ADS] [CrossRef] [EDP Sciences] [Google Scholar]
All Tables
Surface temperature in K for variations in orbital distance d, surface pressure p in bar, and CO2 concentration C.
All Figures
|
Fig. 1 Temperature-pressure profiles for the low CO2 (355 ppm CO2) runs of scenario 2. Equilibrium temperature of the planet (dashed) and melting temperature of water (dotted) are indicated as vertical lines. |
| In the text | |
|
Fig. 2 Temperature-pressure profiles for the 10 PAL CO2 (3.55 × 10⁻³ CO2) runs of scenario 2. |
| In the text | |
|
Fig. 3 Temperature-pressure profiles for the medium CO2 (5% CO2) runs of scenario 2. |
| In the text | |
|
Fig. 4 Temperature-pressure profiles for the high CO2 (95% CO2) runs of scenario 2. |
| In the text | |
Current usage metrics show cumulative count of Article Views (full-text article views including HTML views, PDF and ePub downloads, according to the available data) and Abstracts Views on Vision4Press platform.
Data correspond to usage on the plateform after 2015. The current usage metrics is available 48-96 hours after online publication and is updated daily on week days.
Initial download of the metrics may take a while.