Fig. 9
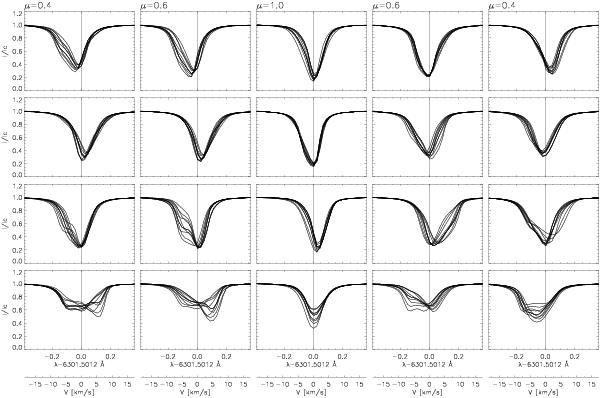
Profiles of Fe i 6301.5 Å computed for four events (see Fig. 3) after the images at every wavelength were degraded to the resolution of the SP/SOT Hinode. Rows from top to bottom correspond to Events 1−4, respectively. Columns correspond to five locations of the snapshot on the solar disk. We also the wavelength axis in terms of corresponding Doppler shifts.
Current usage metrics show cumulative count of Article Views (full-text article views including HTML views, PDF and ePub downloads, according to the available data) and Abstracts Views on Vision4Press platform.
Data correspond to usage on the plateform after 2015. The current usage metrics is available 48-96 hours after online publication and is updated daily on week days.
Initial download of the metrics may take a while.