Fig. 8
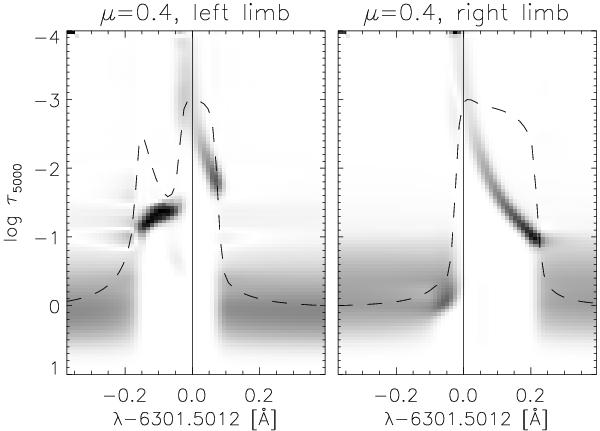
Response function of intensity to temperature variation computed for Fe i 6301.5 Å at μ = 0.4 at opposite limbs. It is computed for the LOS that cuts through the center of the shock at the two disk locations (pale blue, first and fifth column of Figs. 6 and 7). Corresponding line profiles (dashed line) are overplotted in an arbitrary and inverted intensity scale.
Current usage metrics show cumulative count of Article Views (full-text article views including HTML views, PDF and ePub downloads, according to the available data) and Abstracts Views on Vision4Press platform.
Data correspond to usage on the plateform after 2015. The current usage metrics is available 48-96 hours after online publication and is updated daily on week days.
Initial download of the metrics may take a while.