Fig. 7
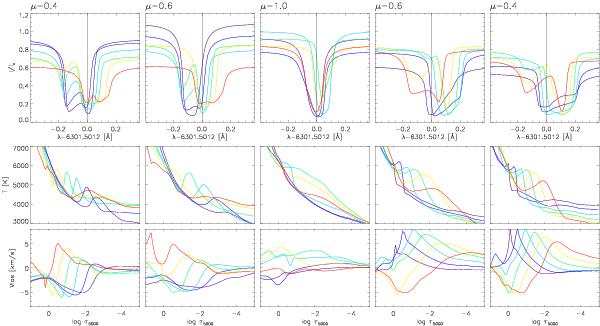
Profiles of the Fe i 6301.5 Å line computed for six LOS’s corresponding to the colors (purple, blue, pale-blue, green, yellow, red) indicated in Fig. 6 for every μ (top row). Temperature and velocity distributions along these LOS’s are shown in the middle and the bottom rows. Positive velocities correspond to motions away from the observer. The line profiles are normalized to the quiet-sun continuum at disk center.
Current usage metrics show cumulative count of Article Views (full-text article views including HTML views, PDF and ePub downloads, according to the available data) and Abstracts Views on Vision4Press platform.
Data correspond to usage on the plateform after 2015. The current usage metrics is available 48-96 hours after online publication and is updated daily on week days.
Initial download of the metrics may take a while.