Fig. 6
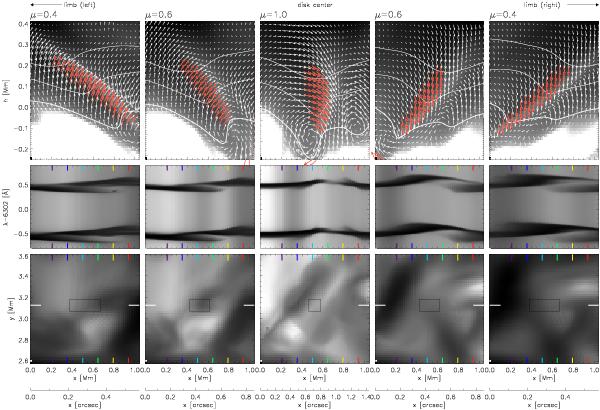
Top row: vertical cross-section through event 3. Subsonic velocities are indicated by white arrows, whereas red arrows correspond to supersonic velocities. The temperature distribution is shown as a background in gray-scale. White curves represent the log τ5000 = 1,−1 and −2 levels, respectively. Middle row: spectrogram of Fe i 6301.5 and 6302.5 Å synthesized from the cross-section; bottom row: continuum intensity maps of the area of the flow. The white markers specify the location of the vertical cross-section in the top panels. The five columns correspond to the five viewing angles specifed at the top. The h coordinate is measured along the line of sight (LOS). The x coordinate is the horizontal simulation coordinate in the center-to-limb plane containing the LOS, not the projected skewed coordinate. The projected extent in arcsec x′ is added underneath. The color markers specify six LOS’s shown in detail in Fig. 7. The box in the bottom row specifies the size of a SP/SOT pixel.
Current usage metrics show cumulative count of Article Views (full-text article views including HTML views, PDF and ePub downloads, according to the available data) and Abstracts Views on Vision4Press platform.
Data correspond to usage on the plateform after 2015. The current usage metrics is available 48-96 hours after online publication and is updated daily on week days.
Initial download of the metrics may take a while.