Fig. 5
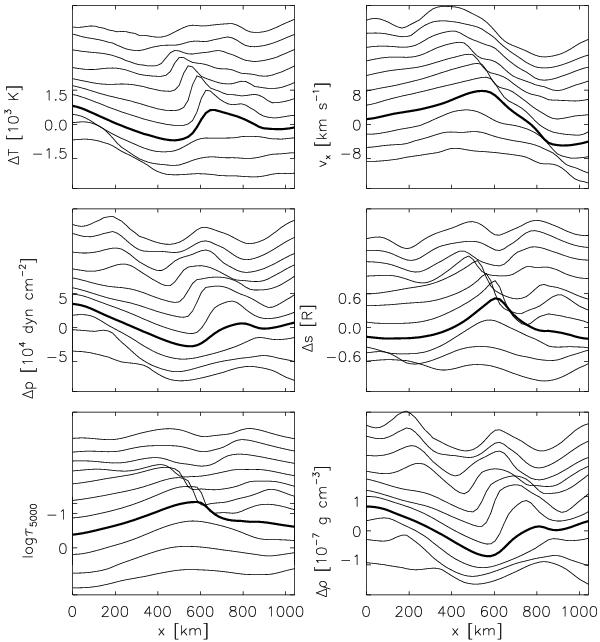
Temporal evolution of the shock front in event 3 at a fixed geometrical height of ~100 km above the average log τ5000 = 0 level. From the bottom up, the curves represent time samples at 25 s intervals. The scale on the vertical axis is for snapshot S1 (thick curve). The range of the horizontal axis is same as in Fig. 6. Upper left panel: temperature deviation from the horizontal mean; upper right: horizontal velocity (positive along x); middle left: pressure deviation from the horizontal mean; middle right: entropy deviation from the horizontal mean in units of the universal gas constant; lower left: log τ5000; lower right: density deviation from the horizontal mean.
Current usage metrics show cumulative count of Article Views (full-text article views including HTML views, PDF and ePub downloads, according to the available data) and Abstracts Views on Vision4Press platform.
Data correspond to usage on the plateform after 2015. The current usage metrics is available 48-96 hours after online publication and is updated daily on week days.
Initial download of the metrics may take a while.