Free Access
Fig. 4
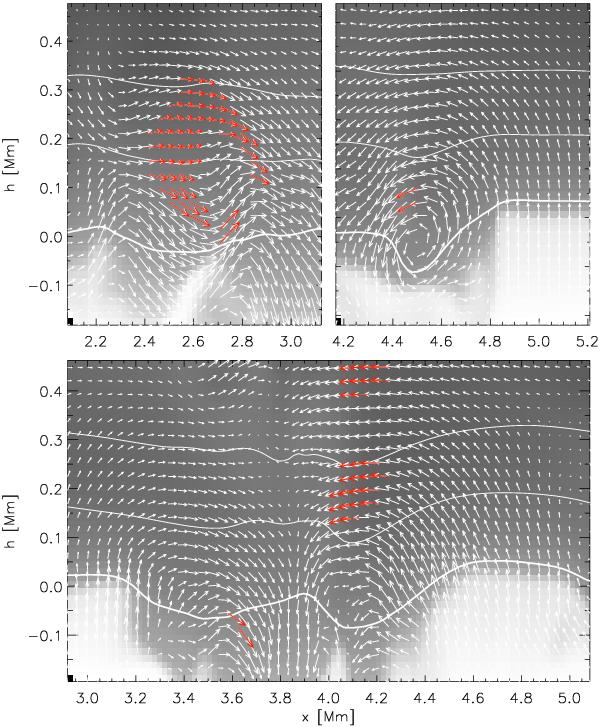
Vertical cross-section of temperature (gray scale) and velocity (arrows) for events 1 and 2 (upper panels) and 4 (lower panel) (cf. Fig. 3). Subsonic velocities are indicated by white arrows, red arrows correspond to supersonic velocities. White curves represent the log τ5000 = 0,−1 and −2 levels, respectively.
Current usage metrics show cumulative count of Article Views (full-text article views including HTML views, PDF and ePub downloads, according to the available data) and Abstracts Views on Vision4Press platform.
Data correspond to usage on the plateform after 2015. The current usage metrics is available 48-96 hours after online publication and is updated daily on week days.
Initial download of the metrics may take a while.