Fig. 3
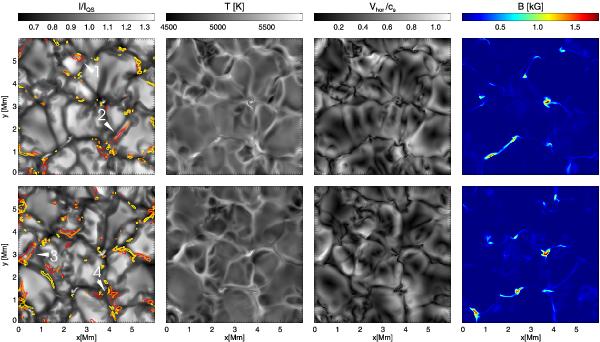
Maps of the two snapshots analyzed in detail (top, S0; bottom, S1). From left to right: continuum intensity at 6300 Å, temperature, magnitude of the horizontal velocity in units of the local sound speed, and total magnetic field strength at the log τ5000 = −1 surface. Contours show the projection on the horizontal plane of cells containing supersonic flows (red specifies flows that are nearly horizontal 120° > γ > 60° and; yellow nearly vertical flows 180° > γ > 150° and 30° > γ > 0°; orange flows with inclinations 150° > γ > 120° and 60° > γ > 30°. The four numbered markers point to selected events discussed in detail in Sect. 3.2.
Current usage metrics show cumulative count of Article Views (full-text article views including HTML views, PDF and ePub downloads, according to the available data) and Abstracts Views on Vision4Press platform.
Data correspond to usage on the plateform after 2015. The current usage metrics is available 48-96 hours after online publication and is updated daily on week days.
Initial download of the metrics may take a while.