Fig. 12
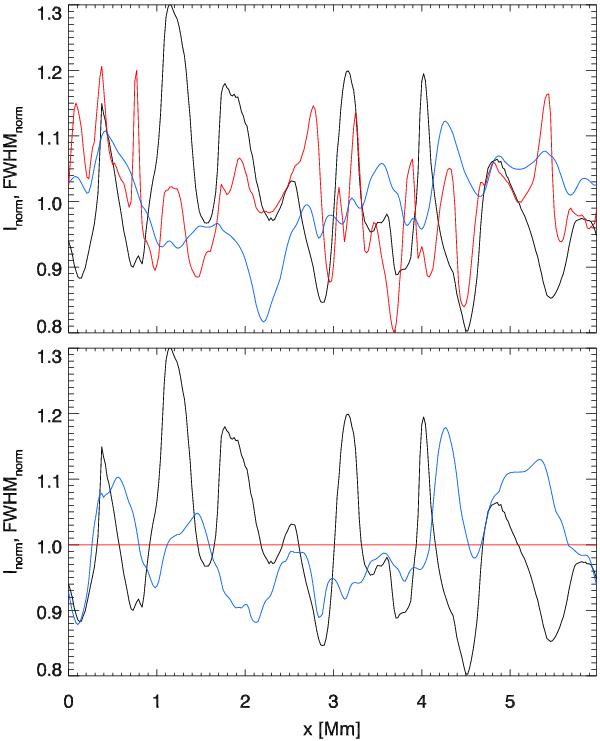
Continuum intensity at 6300 Å and FWHM of the Fe i 6301.5 Å line along a spatial cut of a simulation snapshot. Upper panel: the black curve shows the normalized continuum intensity along the spatial cut at the full resolution of the snapshot. The red curve shows the FWHM of the spectral line profile derived from the simulation at the same spatial location and the blue curve, the FWHM of the spectral lines after smearing. All curves are normalized to their mean values. Lower panel: the black curve shows the normalized continuum intensity along the spatial cut at the full resolution of the snapshot. To demonstrate the influence of the smearing of the snapshot on the FWHM of the spectral line, we carry out a thought experiment and artificially fix the FWHM at each spatial location to a single value (red line) by stretching/compressing the spectral lines. The blue line, showing the FWHM obtained after smearing, still show a large variation. This demonstrates that the detection of an enlarged FWHM is not necessarily an indicator for supersonic flows, but can be an artifact introduced by the smearing.
Current usage metrics show cumulative count of Article Views (full-text article views including HTML views, PDF and ePub downloads, according to the available data) and Abstracts Views on Vision4Press platform.
Data correspond to usage on the plateform after 2015. The current usage metrics is available 48-96 hours after online publication and is updated daily on week days.
Initial download of the metrics may take a while.