Fig. 11
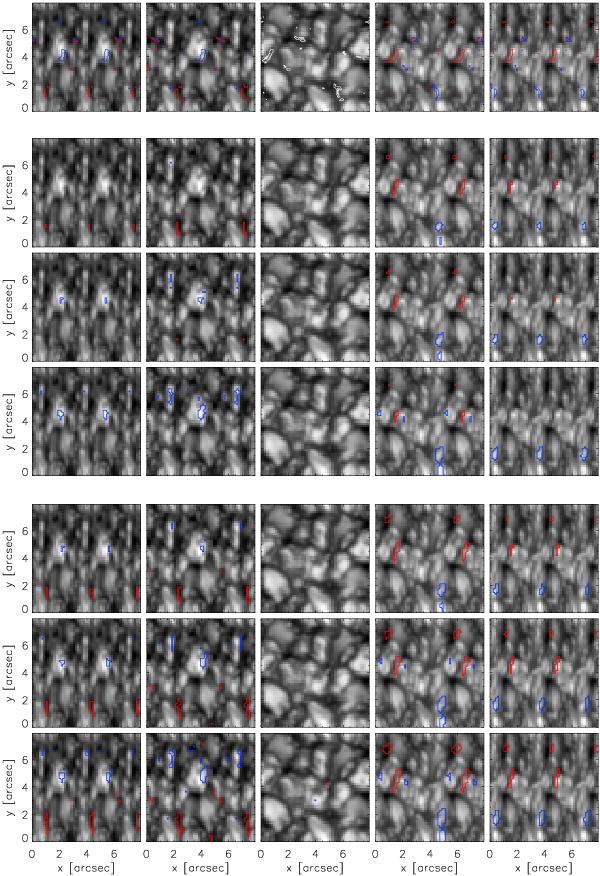
Continuum intensity map computed from snapshot S1 at μ = 0.4 and 0.6 at the “left” limb, at disk center, and at μ = 0.6 and 0.4 at the “right” limb (from left to right). Away from disk center, the foreshortened maps are replicated to fill a square. First row: contours show projection of volumes with supersonic horizontal flows to the plane perpendicular to the line of sight. Flows moving towards the observer are specified in blue; flows moving away from the observer in red. Second row: supersonic flows detected as pixels with bisector velocity smaller than −2.6 km s-1 (blue contours) and larger than 2.6 km s-1 (red). The zero wavelength for the bisector measurement is the laboratory wavelength of the Fe i 6301.5012 Å line. Third and fourth row: the zero wavelength is shifted by 5 and 10 mÅ towards the red, respectively. In the bottom three rows, the zero wavelength is the laboratory wavelength for all panels, but the threshold for the determination of supersonic flows varies: ±2.4 km s-1 (fifth row), ±2.2 km s-1 (sixth) and ±2.0 km s-1 (seventh).
Current usage metrics show cumulative count of Article Views (full-text article views including HTML views, PDF and ePub downloads, according to the available data) and Abstracts Views on Vision4Press platform.
Data correspond to usage on the plateform after 2015. The current usage metrics is available 48-96 hours after online publication and is updated daily on week days.
Initial download of the metrics may take a while.