Fig. 1
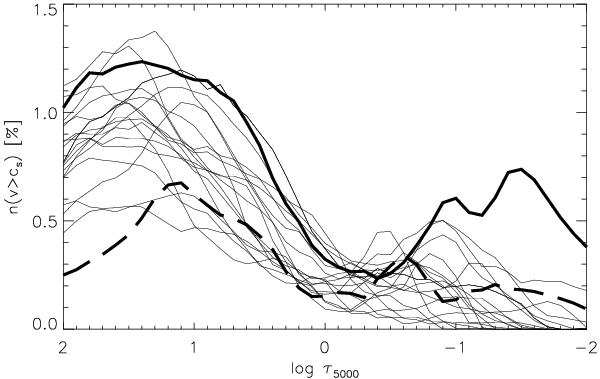
The fraction of dx × dy × d(log τ) cells with supersonic flows versus optical depth for disk center viewing with μ = 1. Each curve represents one of the 20 analyzed snapshots. The supersonic flow may be in any direction. The thick solid curve corresponds to the snapshot with the largest abundance of supersonic flows (S1, lower row in Fig. 3), while the thick dashed curve corresponds to the initial snapshot (S0, upper row in Fig. 3).
Current usage metrics show cumulative count of Article Views (full-text article views including HTML views, PDF and ePub downloads, according to the available data) and Abstracts Views on Vision4Press platform.
Data correspond to usage on the plateform after 2015. The current usage metrics is available 48-96 hours after online publication and is updated daily on week days.
Initial download of the metrics may take a while.