Fig. 7
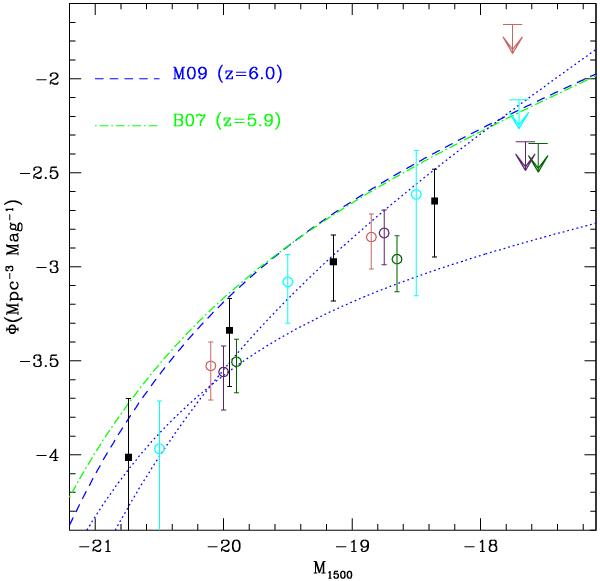
The LF at z = 7, obtained using different distributions for the simulated half light radii, namely the uniform one (template 7, cyan points), and the three log-normal distributions (template 8 using dark pink points, template 9 using dark green points, and template 10 using purple points). The dark green bins are shifted by +0.1 mag, while the dark pink points are moved by −0.1 mag, respectively, for clarity. The blue dotted lines indicate the range of variability for the best fit of α spanning the range −2.15 ≤ α ≤ −1.38. The blue dashed and green dot-dashed lines show the LF at z = 6 of McLure et al. (2009) and Bouwens et al. (2007), respectively. The filled black squares are the LF presented in Oesch et al. (2010a).
Current usage metrics show cumulative count of Article Views (full-text article views including HTML views, PDF and ePub downloads, according to the available data) and Abstracts Views on Vision4Press platform.
Data correspond to usage on the plateform after 2015. The current usage metrics is available 48-96 hours after online publication and is updated daily on week days.
Initial download of the metrics may take a while.