Fig. 6
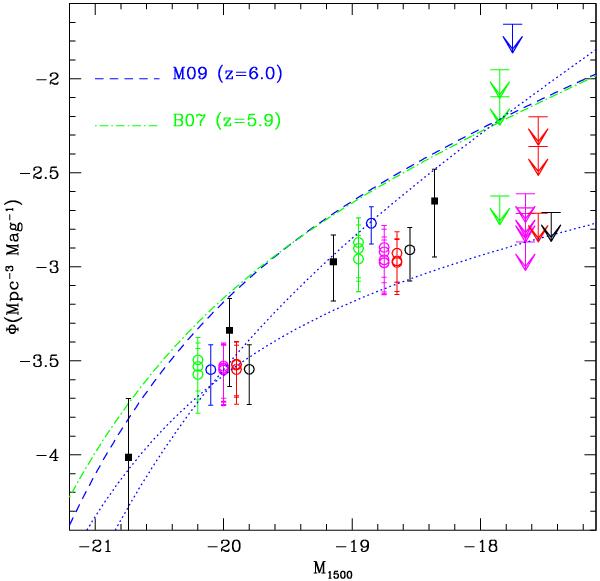
The LF at z = 7, obtained using as morphological types galaxies drawn from the templates 1−6. The color code is the same of Fig. 4. The blue and green bins are shifted by −0.2 and −0.1 mag, while the red and black points are moved by +0.1 and +0.2, respectively, for clarity. The blue dotted lines indicates the range of variability for the best fit of α spanning the range −2.15 ≤ α ≤ −1.38. The blue dashed and green dot-dashed lines show the LF at z = 6 of McLure et al. (2009) and Bouwens et al. (2007), respectively. The filled black squares are the LF presented in Oesch et al. (2010a).
Current usage metrics show cumulative count of Article Views (full-text article views including HTML views, PDF and ePub downloads, according to the available data) and Abstracts Views on Vision4Press platform.
Data correspond to usage on the plateform after 2015. The current usage metrics is available 48-96 hours after online publication and is updated daily on week days.
Initial download of the metrics may take a while.