Fig. 4
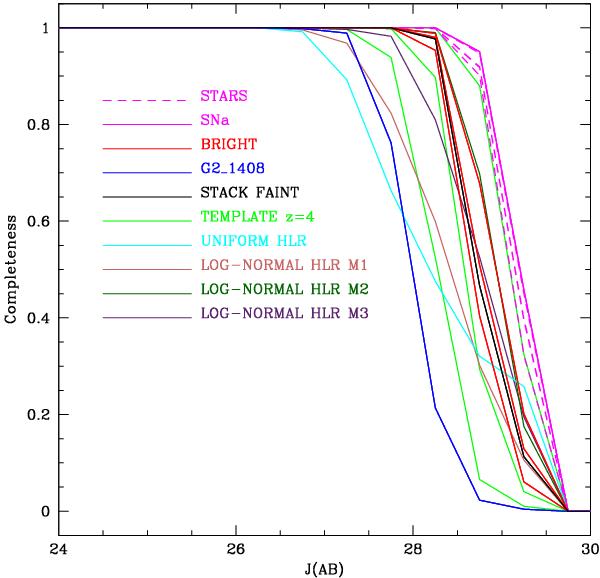
The fraction of detected galaxies versus the J125 input magnitude for the simulations in the HUDF field. Different colors indicate the various morphologies adopted: the dashed magenta lines indicate non-saturated stars on the HUDF survey (morphological template 1). The solid magenta line shows the completeness obtained using the SNa candidate outlined by Oesch et al. (2010a) (template 2) as morphological template, while the red solid curves show the three brightest z ~ 7 candidates of the HUDF survey (template 3). The blue solid line is the completeness derived by adopting as template the brightest candidate in the HUDF (HUDF-1095 or G2_1408 of Castellano et al. 2010a, template 4), and the black solid line represents the completeness obtained adopting as input template the stack of the faint candidates selected in the HUDF (template 5). The green dashed lines indicate the spectroscopically confirmed galaxies z ~ 4, shifted at z = 7 (template 6). The cyan solid line shows the completeness obtained assuming a uniform distribution in half light radius (template 7), while the dark pink and green solid lines indicates the results of two log-normal distributions in half light radius adopted by Ferguson et al. (2004), Oesch et al. (2007, 2010a) (template 8, M1) and by Oesch et al. (2010b) (template 9, M2), respectively. The purple line indicates the completeness derived from Vanzella et al. (2009) (template 10, M3).
Current usage metrics show cumulative count of Article Views (full-text article views including HTML views, PDF and ePub downloads, according to the available data) and Abstracts Views on Vision4Press platform.
Data correspond to usage on the plateform after 2015. The current usage metrics is available 48-96 hours after online publication and is updated daily on week days.
Initial download of the metrics may take a while.