Fig. 10
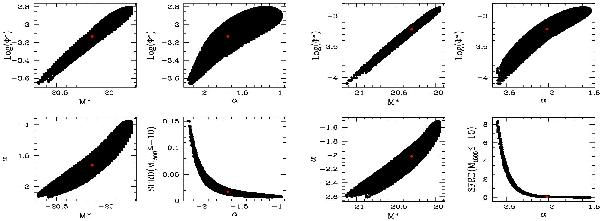
The confidence regions at 68% c.l. (1σ) for the LF parameters and the SFRD. The red points show the projection of the best fit. The plot on the left shows the confidence regions based on the simulations with compact morphology (template 5), while the right plot is related to extended morphology (template 4).
Current usage metrics show cumulative count of Article Views (full-text article views including HTML views, PDF and ePub downloads, according to the available data) and Abstracts Views on Vision4Press platform.
Data correspond to usage on the plateform after 2015. The current usage metrics is available 48-96 hours after online publication and is updated daily on week days.
Initial download of the metrics may take a while.