Fig. 1
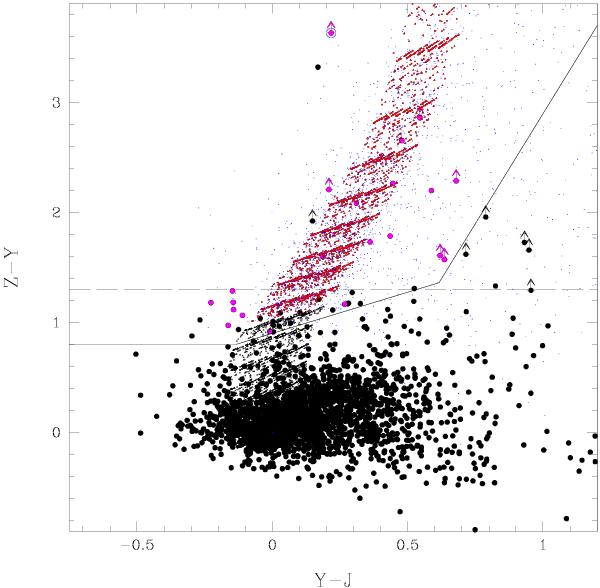
The Z − Y vs. Y − J color − color diagram for the HUDF dataset limited at J < 29.2. Big points are observed galaxies, small black points are CB07 models at 0.0 < E(B − V) < 0.3, with small red points those at z > 6.5. The small blue points are the result of our simulations, with synthetic objects inserted in the FITS images and recovered using the same procedure used for the observed catalog. The solid line is the color cut of the A criterion, while the dashed line shows the B criterion (described in Sect. 3). Candidate galaxies at z ~ 7 selected with criterion C are shown in magenta. Vertical arrows are upper limits in the Z band, while the blue circle at Z − Y > 3.6 is the suspected SNa outlined by Oesch et al. (2010a).
Current usage metrics show cumulative count of Article Views (full-text article views including HTML views, PDF and ePub downloads, according to the available data) and Abstracts Views on Vision4Press platform.
Data correspond to usage on the plateform after 2015. The current usage metrics is available 48-96 hours after online publication and is updated daily on week days.
Initial download of the metrics may take a while.