Fig. 8
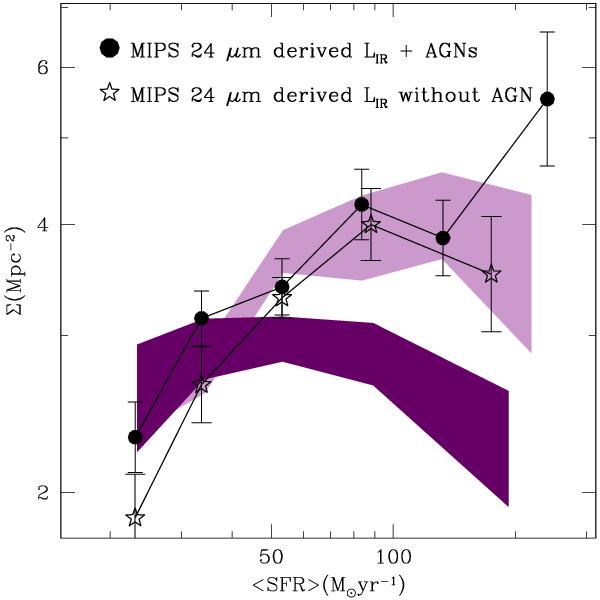
Density–SFR relation obtained using only 24 μm derived SFR. The filled points show the relation obtained with 24 μm only derived SFR with the AGN contribution, the empty stars show the same without AGN contribution. The positive correlation does not disappear after removing the AGN when 24 μm derived SFR are used. The shaded regions show the density–SFR relations estimated with PACS+MIPS data: pink region is the density–SFR relation with the AGN contribution, the violet region is the same without AGN contribution.
Current usage metrics show cumulative count of Article Views (full-text article views including HTML views, PDF and ePub downloads, according to the available data) and Abstracts Views on Vision4Press platform.
Data correspond to usage on the plateform after 2015. The current usage metrics is available 48-96 hours after online publication and is updated daily on week days.
Initial download of the metrics may take a while.