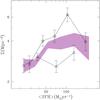
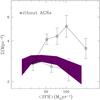
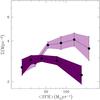
Fig. 6
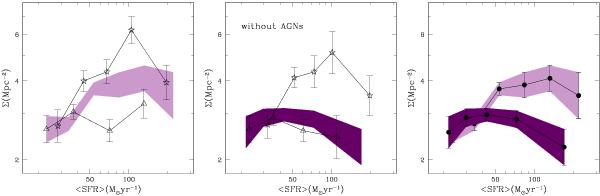
Density–SFR relation. We show the relation obtained by including the low luminosity obscured AGNs (left panel) and the relation obtained after removing the AGNs from the sample (middle panel). In these panels the shaded regions show the global relations at M/M⊙ > 8 × 10⁹, empty triangles show the relation obtained in the low mass sample (8 × 10⁹ < M/M⊙ < 5 × 10¹⁰), stars show the relation obtained in the high mass sample (M/M⊙ > 5 × 10¹⁰). The right panel show the comparison of the global relations obtained by inclusion (pink area) and excluding (purple area) the AGNs in the sample.
Current usage metrics show cumulative count of Article Views (full-text article views including HTML views, PDF and ePub downloads, according to the available data) and Abstracts Views on Vision4Press platform.
Data correspond to usage on the plateform after 2015. The current usage metrics is available 48-96 hours after online publication and is updated daily on week days.
Initial download of the metrics may take a while.