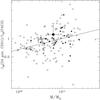
Fig. 2

LIR,24 μm/LIR,PACS ratio versus LIR,24 μm obtained using the CE01 method, in the left panel. LIR,24 μm/LIR,PACS ratio versus the M/M⊙ using the CE01 method, in the central panel. LIR,24 μm/LIR,PACS ratio versus the LIR,24 μm obtained using the R10 method, in the right panel. In all panels empty circles are normal star forming galaxies in our sample with both a MIPS 24 μm and PACS 100 or 160 μm detection. Filled points are low luminosity obscured AGNs with both a MIPS 24 μm and PACS 100 or 160 μm detection. The point with error bar is the result of the stacking analysis in the GOODS-N 160 μm map of the obscured AGNs of our sample with only MIPS detection.
Current usage metrics show cumulative count of Article Views (full-text article views including HTML views, PDF and ePub downloads, according to the available data) and Abstracts Views on Vision4Press platform.
Data correspond to usage on the plateform after 2015. The current usage metrics is available 48-96 hours after online publication and is updated daily on week days.
Initial download of the metrics may take a while.


